How do you know if your push notification campaigns are performing well? Measuring success on a strategy level, campaign level, and notification level is crucial in understanding whether your messages are supporting your business goals.
Evaluating your key metrics helps you know what your audience is receptive to and what high-level strategies are driving user engagement and excitement. In this article, we’ll get into several telling metrics that will help you evaluate and refine your push notification strategy as you go.
Message delivery rate and delivery speed serve as a baseline for many other performance metrics you’ll track, so it’s important to understand how your messaging provider defines and tracks these values.
Delivery Rate
What impacts whether or not a notification is delivered? There are several factors that affect message delivery rates.
- Opt-outs: Messages will go undelivered to users who have opted out of receiving notifications.
- Network Connectivity: Network latency affects notification delivery. Users connected to Wifi, 4G, and 5G networks see higher delivery rates because of lower network latency. However, phones connected to 2G and 3G networks are more likely to never receive your notification.
- Notification Time-outs: If a user is out of network when you send a notification, GCM or FCM will fail to send push notifications to the end user’s device. This leads to a notification timing out even after the device has reconnected to the network.
- Device Manufacturer: Chinese Original Equipment Manufacturers (OEMs) like Xiaomi, Vivo, and Oppo limit certain background processes to optimize for battery life and processor bandwidth. These background processes stand between FCM push gateway and the end user’s device.
Delivery Speed
Delivery speed is usually tracked as the number of messages delivered per interval of time. For example, Onesignal delivers over one million messages per second. Not every provider’s delivery speed and reliability are the same, so make sure to check out your provider’s uptime statistics if they’re publicly available.
Click-Through Rate (CTR)
Click-through rate (CTR) represents the number of notifications that were clicked out of the total notifications that were successfully delivered. Delivery refers to the number of notifications successfully passed through the FCM/APNS servers and sent to subscribers. For push notifications, an accurate click-through rate excludes users that swiped away a notification, dismissed a notification, or cleared a notification.
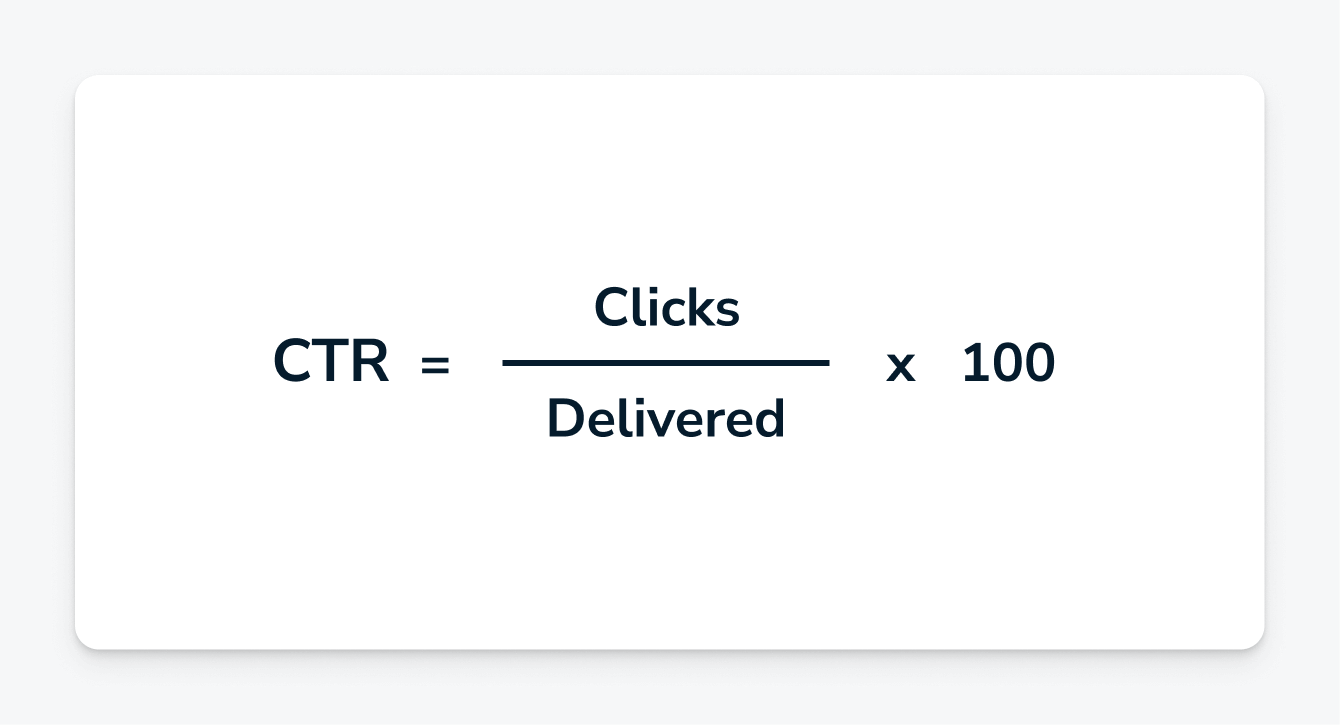
Some CTR formulas use "impressions" rather than delivered notifications as the fraction denominator. An impression refers to the number of times a notification, advertisement, or message was viewed by an audience, but what constitutes a "view" may vary between industries and channels. For push notifications, confirmed delivery is a more precise metric that will tell you how many impressions a notification has truly received, excluding notifications that have been automatically dismissed.
CTR is a pivotal metric for understanding the success of your campaigns. CTR can vary widely between verticals. Our data shows that across different apps, the average click-through rate for push notifications ranged from 0.8 to 40 percent, which represents exceptionally high variance.
To understand your CTR, you should evaluate standard CTR benchmarks for your industry and chosen messaging channel. Bear in mind that different messaging channels have different engagement rates, strengths, and weaknesses. For instance, emails have an average open rate of less than two percent, whereas push notifications have an average open rate of 20 percent. Within and among your campaigns, you should use CTR as an indicator of user engagement and as a comparative metric in your A/B tests.
Confirmed Delivery
Confirmed delivery is an accurate measurement of the number of devices that actually received your notification.
This metric is critical because it accounts for errors in the calculation of click-through rate (CTR). If your impression value is derived from your total sent messages rather than total confirmed deliveries, you run the risk of counting “phantom subscribers,” or users who haven’t technically unsubscribed. These users might have downloaded your app, but their device may be powered off or not in use.
Understanding confirmed delivery will help you accurately evaluate the health of your messaging pipeline and optimize your messaging strategy.
Influenced Opens
It’s important to understand the influence your notifications have on user behavior. In the world of mobile push notifications, app opens are a key success metric. Oftentimes, your users may not immediately open your app after receiving a push message. However, they may plan to revisit your app later in the day in close succession to receiving your app’s reminder.
Influenced opens refer to app opens in close succession to a user’ receiving your notification. This metric can be set on a customizable attribution window, such as15 minutes, an hour, or 24 hours after a push was received. Apps with different functionality will have different significant attribution windows. For example, a gaming app may set an attribution window of 24 hours to account for users who receive a notification at school or work during the day and only get around to playing in their free time at night.
Influenced opens help you more accurately gauge the impact your notifications have on user behavior. Realistically, your notifications have a lot of value in driving user re-engagement over periods of time in addition to just immediate app opens.
Subscriber Trends
Subscribers and Unsubscribes
Subscriber trends are a key indicator of the health of your push campaigns. Subscriber count can be influenced by the timing, content, and placement of your opt-ins. Unsubscribes may indicate users’ annoyance or disinterest in receiving your notifications.
Push providers will generally track subscription data through their SDK. This data is usually available in the user dashboard. Android app users are automatically subscribed to notifications, whereas iOS mobile app users must opt-in in order to receive notifications and be tracked as subscribers.
Unsubscribes occur when users either uninstall your app or when you unsubscribe them through the SDK or API device call.
Although your number of subscribers and unsubscribes is bound to fluctuate, it’s important to monitor the overall trend in these metrics over time. If the overall trend shifts drastically in a positive or negative direction, take into account what changed in your notification strategy to identify a cause and optimize your approach.
Monthly Active Users
Monthly active users (MAU) is a count of the number of subscribers who are active in your app in a given timeframe. In this case, “activity” is defined by opening a notification, opening an app, or receiving "tags" from your app. Monthly active user count excludes devices that receive notifications or tag updates from the API, but are otherwise inactive.
MAU is a stickiness metric that reveals how well your app is retaining users over time. Because of this, MAU is a Key Performance Indicator (KPI) for many mobile-first businesses. This metric may also relate to other trends such as the success of your marketing campaigns in attracting new users, your users’ interest in your product or service, your retention rate, churn rate, and growth rate. Ultimately, these metrics relate back to your app’s revenue growth and potential, so it’s important to keep tabs on this metric.
Custom Outcome Tracking
Custom outcome tracking allows you to measure user actions that are specific to your company or application. This metric allows you to quantify precise actions you’d like to track, such as a user updating their profile, checking into a hotel room through your travel app, or completing a purchase. Custom outcomes may be quantified as event counts, sums, or unique events.
Session Count & Sums
Session counts and sums are examples of custom outcomes that can be valuable to your business. A new “session” is created when a user clicks a notification and opens your app.
Session Volume
Session volume refers to the number of sessions that resulted from a push notification, while session sum refers to the cumulative session time of all sessions resulting from a push notification. A count is the frequency of the outcome, while the sum is the addition of all outcome values.
Direct Sessions
A direct session is registered when the user opens the app or site from a push, while an influenced session is registered when a user opens the app within a defined attribution window.
Examples of custom outcomes you may want to track include the number of purchases made as a result of abandoned cart notifications, airport “check-in’s” as a result of reminder notifications, or the impact of your peanut/jelly cross sell promotional notifications.
Custom outcomes help you gauge the direct and indirect impact of your campaigns. While a simple CTR misses the nuances of influenced outcomes, custom outcomes give you a more precise understanding of how your notifications are impacting a desired user behavior, beyond a simple click.
More Strategies to Boost App Performance
User retention is another important metric to track in order to understand the impact of your push notification campaigns, evaluate the success of your app, and identify areas for improvement. Check out the article below to learn tips for tracking user retention and actionable strategies to improve your short and long-term retention rates.
Read: Easy Strategies to Increase App Retention