There are a lot of messaging stats out there, but what do they mean and what value can they provide? We've outlined four powerful ways you can use industry statistics to improve your engagement strategy, boost ROI, and enhance your customer experience.
4 Ways to Use Customer Engagement Statistics to Your Advantage
To Keep Tabs on Industry Trends
One invaluable way to use customer engagement statistics is to stay current with industry trends. Although qualitative statistics based on business sentiment and goals often don’t make headlines, they can speak volumes about how companies are thinking about their engagement strategy, where they’re spending their budget, what challenges they're facing, and how you’ll need to evolve to keep pace.
Key Stat from the 2022 State of Customer Messaging Report:
The majority of businesses said that mobile push notifications are the most effective re-engagement channel for their business and the most important channel to their business overall.
What it means:
Although mobile was already an important channel prior to 2020, the pandemic has transformed mobile customer experiences into a top priority for many companies. And for good reason — people are spending more time on mobile channels than ever before. Reports show that users spent 30 percent more time per day on mobile apps in 2021.
And where users go, savvy businesses will inevitably follow. Mobile app spending rose by 20 percent to reach $170 billion in 2021 and mobile advertising spending is on track to surpass desktop advertising spending in 2022.
If there was any question as to why mobile push notifications were voted as the most important channel, the answer is simple: they work. The immediacy of mobile push notifications makes this channel ideal for re-engaging users where they’re at and enticing them to come back to an app or website.
If you look a little further into industry statistics from 2021 and 2022, you'll see that just because brands are prioritizing mobile experiences doesn't mean they're deprioritizing other channels. Forrester called 2022 "the year of the grand pivot" wherein brands must use first-party data to create more individual and seamless omnichannel experiences.
To Enhance Your Customer Experience
If you remember one thing from this article, remember to heed the data coming directly from your audience. Key customer experience insights include messaging campaign performance data, user preferences and behaviors, and other forms of customer feedback such as product reviews and public comments. In addition to reviewing CRM and messaging analytics, A/B testing features can help you explore customer preferences in different contexts, understand user expectations, and translate your learnings into real-time gains.
In-app surveys, rating requests, social channels, and support tickets are all valuable forums to solicit actionable feedback from your customers. Once you've compiled common challenges, product requests, and usage trends, use them to prioritize improvements and ensure that you're evolving in lockstep with your customer's needs.
Key Stat from the 2022 State of Customer Messaging Report:
On average, A/B testing leads to a 15% improvement in messaging engagement.
What it means:
Oftentimes, brands put A/B testing on the back burner because they think that it requires too much work or only leads to incremental improvements. The truth is, this optimization practice is quick and easy to implement with the right tool and can lead to valuable discoveries that have significant bottom-line impacts.
To Identify Growth Opportunities
Messaging stats that identify the impact of different strategies, features, or tools are a great place to look if you’re trying to grow your business or make the case for additional resources. For instance, if you know that messages that use Segments have an 83% higher engagement rate on average (true stat!), it’s likely worth thinking about what segmentation criteria you can use to better target and personalize your messages.
Key Stat from the 2022 State of Customer Messaging Report:
Notifications that use personalized content have a 259% higher engagement rate than notifications that don’t use personalized content.
What it means:
Anytime you see an astronomical performance stat, it's worth taking note of. Although there's no magic bullet when it comes to your messaging strategy, stats that show the positive impact of different messaging features and channels are a good place to start if you're looking for reliable short and long-term growth strategies.
There are countless stats that demonstrate the power of personalized marketing and this one just adds more fuel to the fire. For companies that already send push notifications, adding some automated personalization can have an astronomical impact on app engagement and ROI. And you don't need to personalize every detail to have an impact — start with what's easy and possible now and build out your strategy as you grow.
To Contextualize Your Messaging Performance
Although it’s easy to track changes in your own messaging performance, it can be difficult to know what’s truly “good” and how you compare to your competition without looking beyond your own data. Messaging performance stats from annual industry reports can tell you if you’re killing it or have room for growth in different areas.
Key Stat from the 2022 State of Customer Messaging Report:
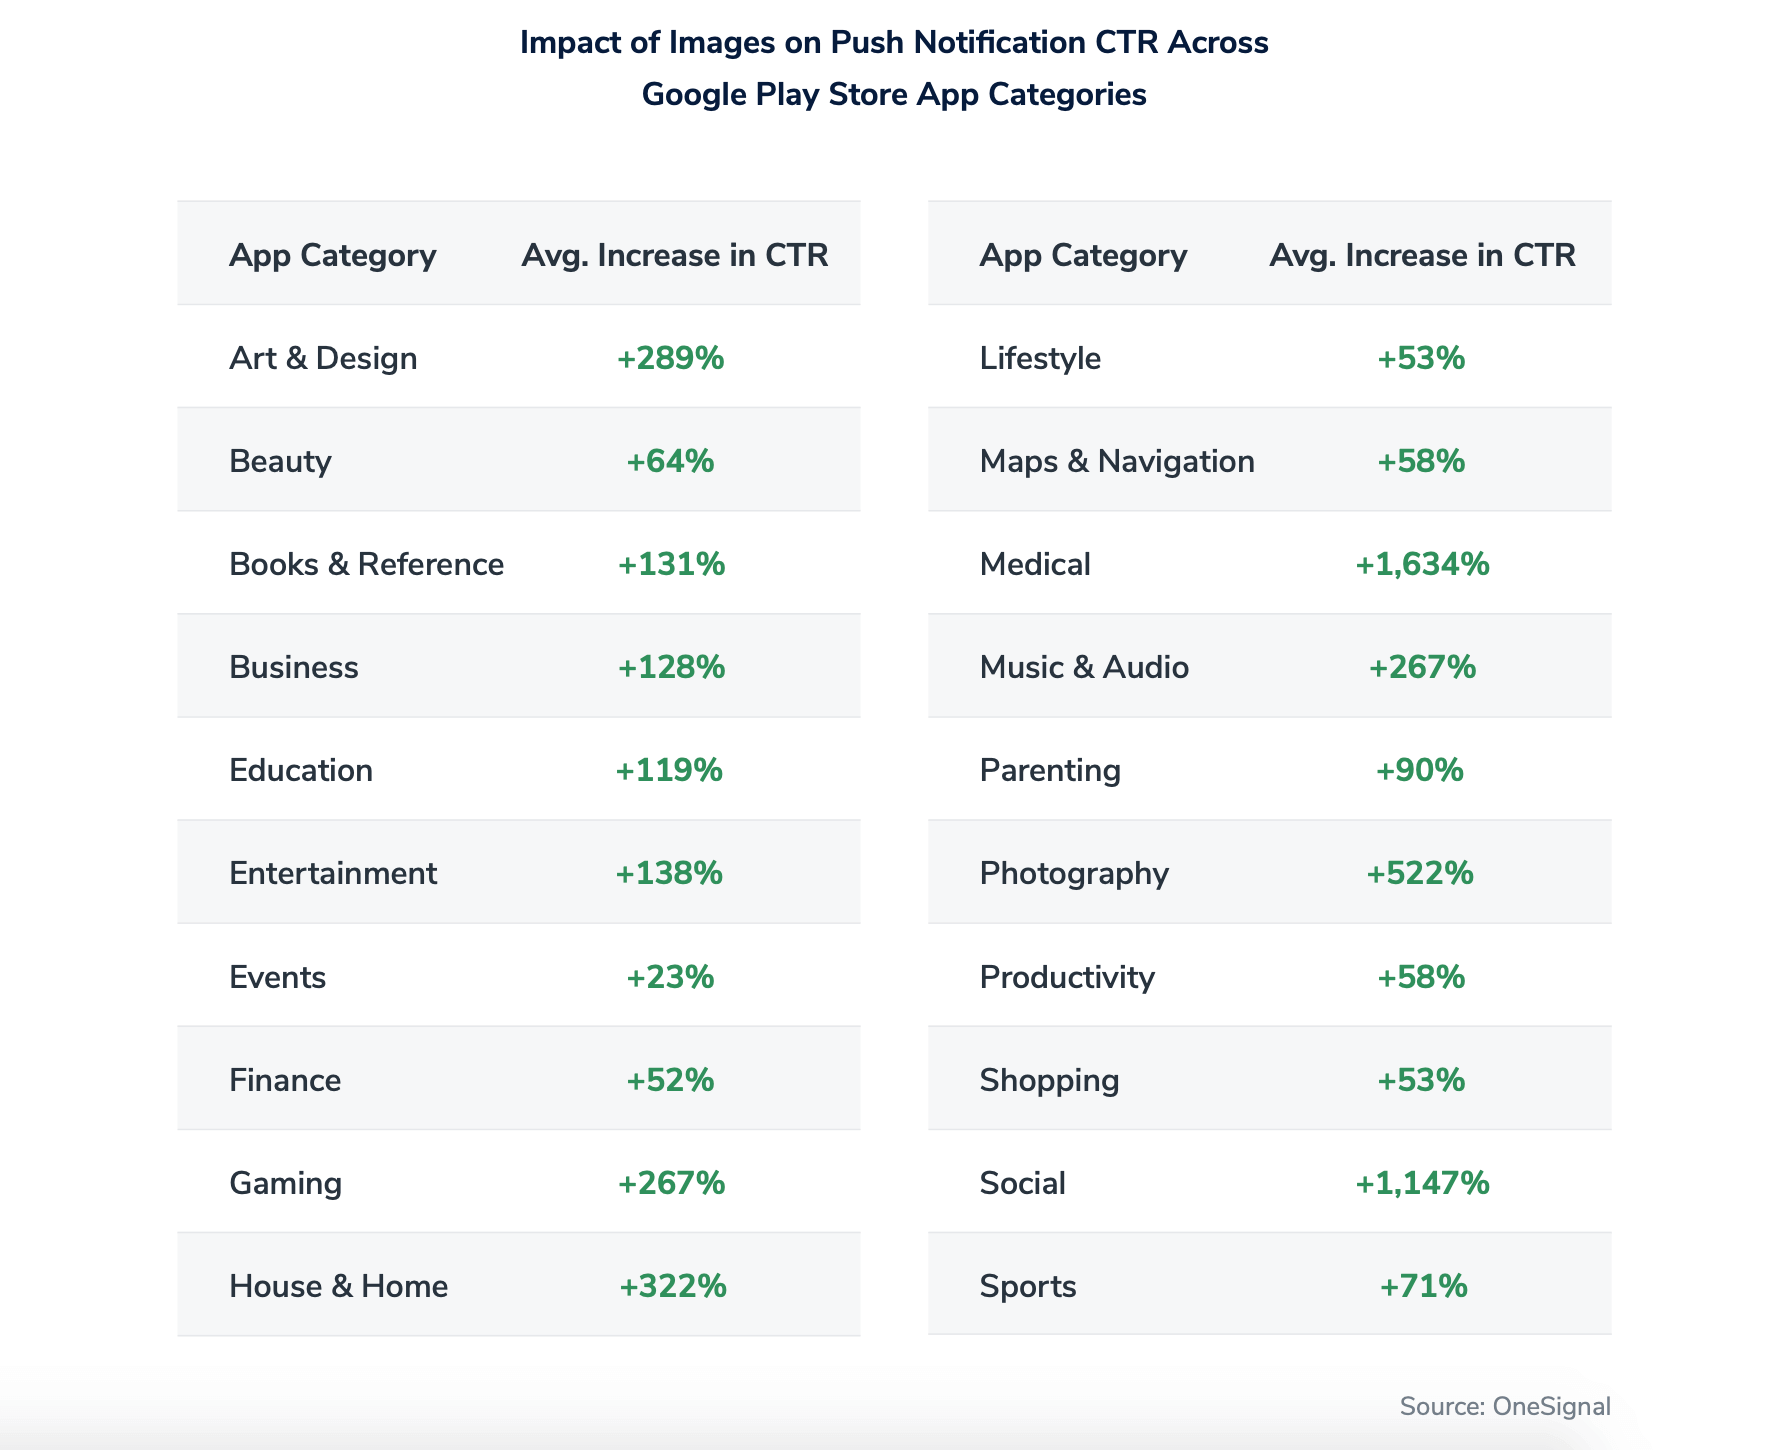
What it means:
Although there are a variety of messaging best practices that apply to every industry, success is often relative between verticals. When you’re trying to evaluate your messaging performance, it’s important to consider how performance varies by industry, company size, messaging channel, and subscriber base to ensure you’re comparing apples to apples.
The table above clearly shows that adding images to mobile push notifications will benefit your messaging strategy. To figure out how to set realistic goals and how to benchmark success, it's important to take note of industry-specific app data.
Key Customer Messaging Insights from 2022 and What They Mean
We surveyed more than 500 product and marketing professionals, engineers, and C-suite members from small startups to international brands across different industries and analyzed 100 billion messages sent through OneSignal in order to understand how different communication strategies and features impact campaign performance. We compiled those insights into our annual State of Customer Messaging in 2022 Report.
Download the full, free State of Customer Messaging & Engagement in 2022 report to uncover more insights to help evolve your communication strategy.
Get the Report