Wondering how much traffic your messaging drives? Not sure if that promotional campaign was successful? Analyze the effectiveness of your campaigns across all your digital channels with UTM tracking parameters and Google Analytics.
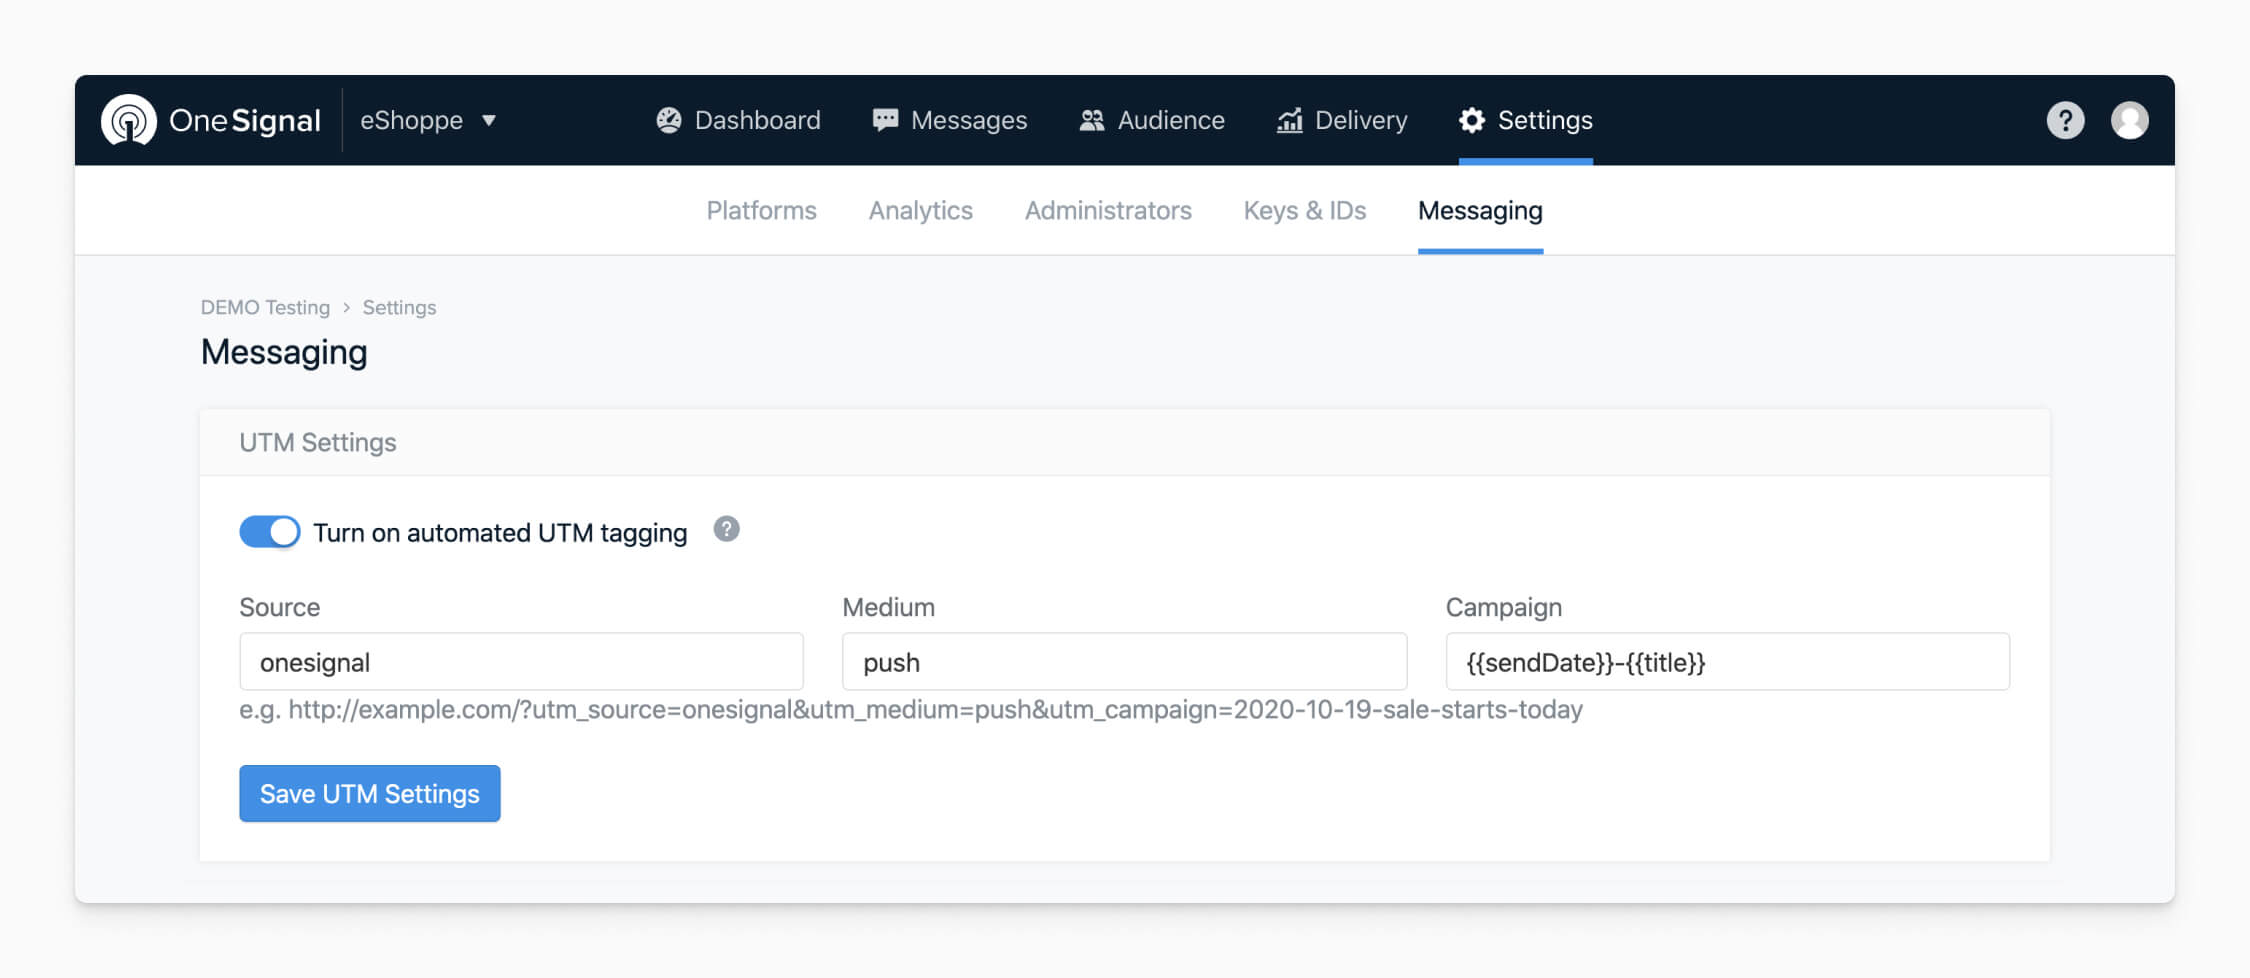
When users click on a link with UTM tags and land on your website or app, Google Analytics associates that specific campaign with the users and their behavior after the click. First, you need to make sure your UTMs are set up correctly. Creating and setting up UTMs can be difficult and tedious, but OneSignal makes it easy by automatically tagging your push campaigns with UTMs. Use OneSignal to add UTMs to your push notifications with a single click, and then use Google Analytics to track campaign effectiveness and drive business insights.
Common Google Analytics Filters
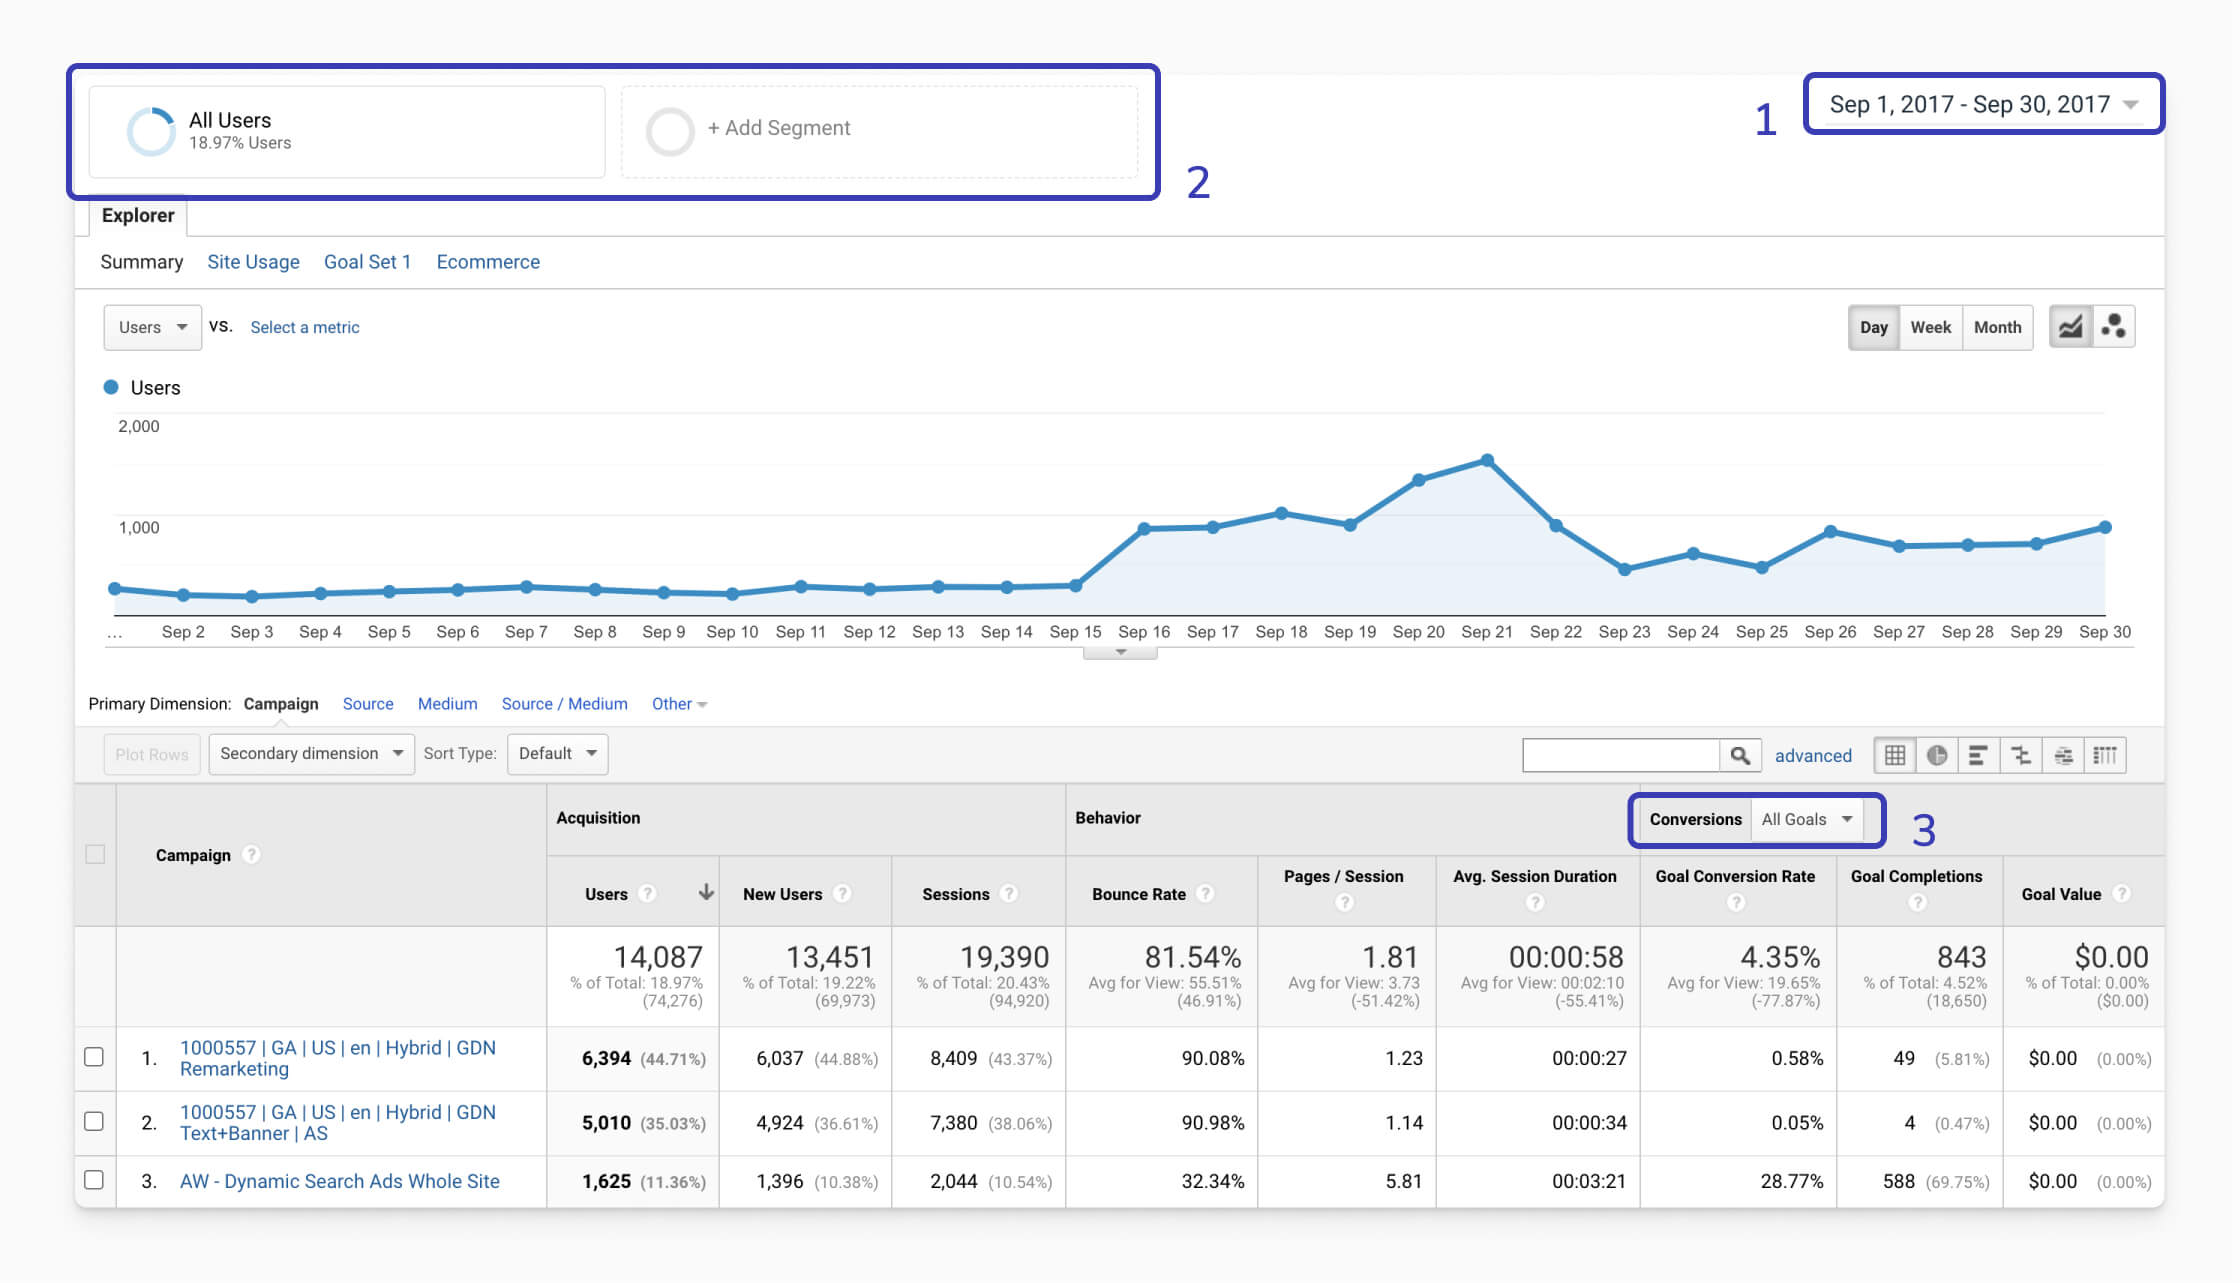
Use Google Analytics to understand your traffic, behavior, and conversion data. Let’s start with an overview of some filters that are commonly used to customize your data. These include date, audience segmentation, and goals.
- Select the appropriate date range. Compare data between different time periods to analyze changes over time.
- Add Segments to narrow down your audience, and compare up to 4 segments at a time. Example segments include new vs. returning visitors, mobile vs. tablet / desktop traffic, or converters vs. non-converters.
- Choose the desired goal to see conversion data.
Understand Your Campaigns
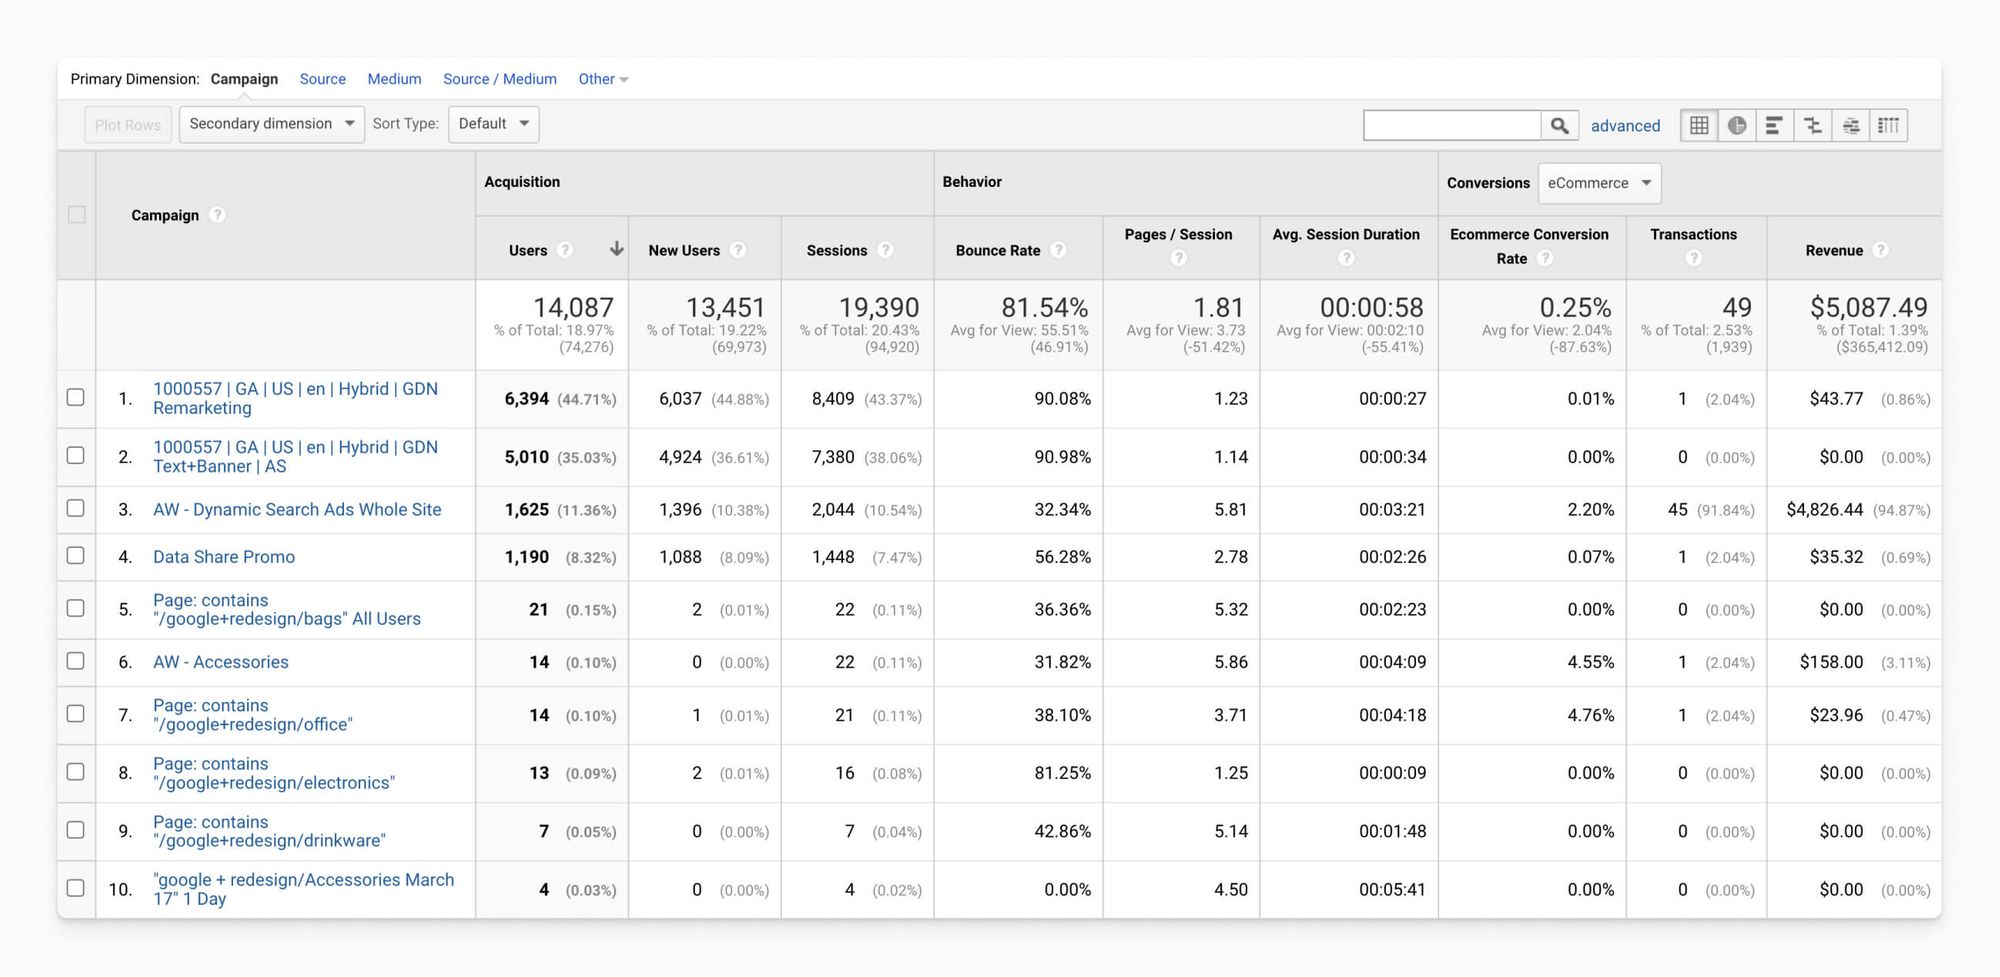
Compare traffic, behavior, and conversion data across your different campaigns. Go to Acquisition > Campaigns > All Campaigns. The All Campaigns report shows results by each campaign. Compare metrics across different campaigns, including users, sessions, bounce rates, and goal conversions. Use this to identify successful campaigns to replicate and underperforming campaigns to improve. For example, if you’ve noticed a significant bump in conversions in the past week and want to know why, check this view to see the performance of your campaigns and understand what drove the changes.
If you’ve used the same campaign tag for different sources or mediums, you can click into the specific campaign to compare performance for the same campaign across different channels. You can also add a secondary dimension for deeper insight. For example, add Device Category to understand how performance is different by mobile, tablet, or desktop.
Understand Your Audiences
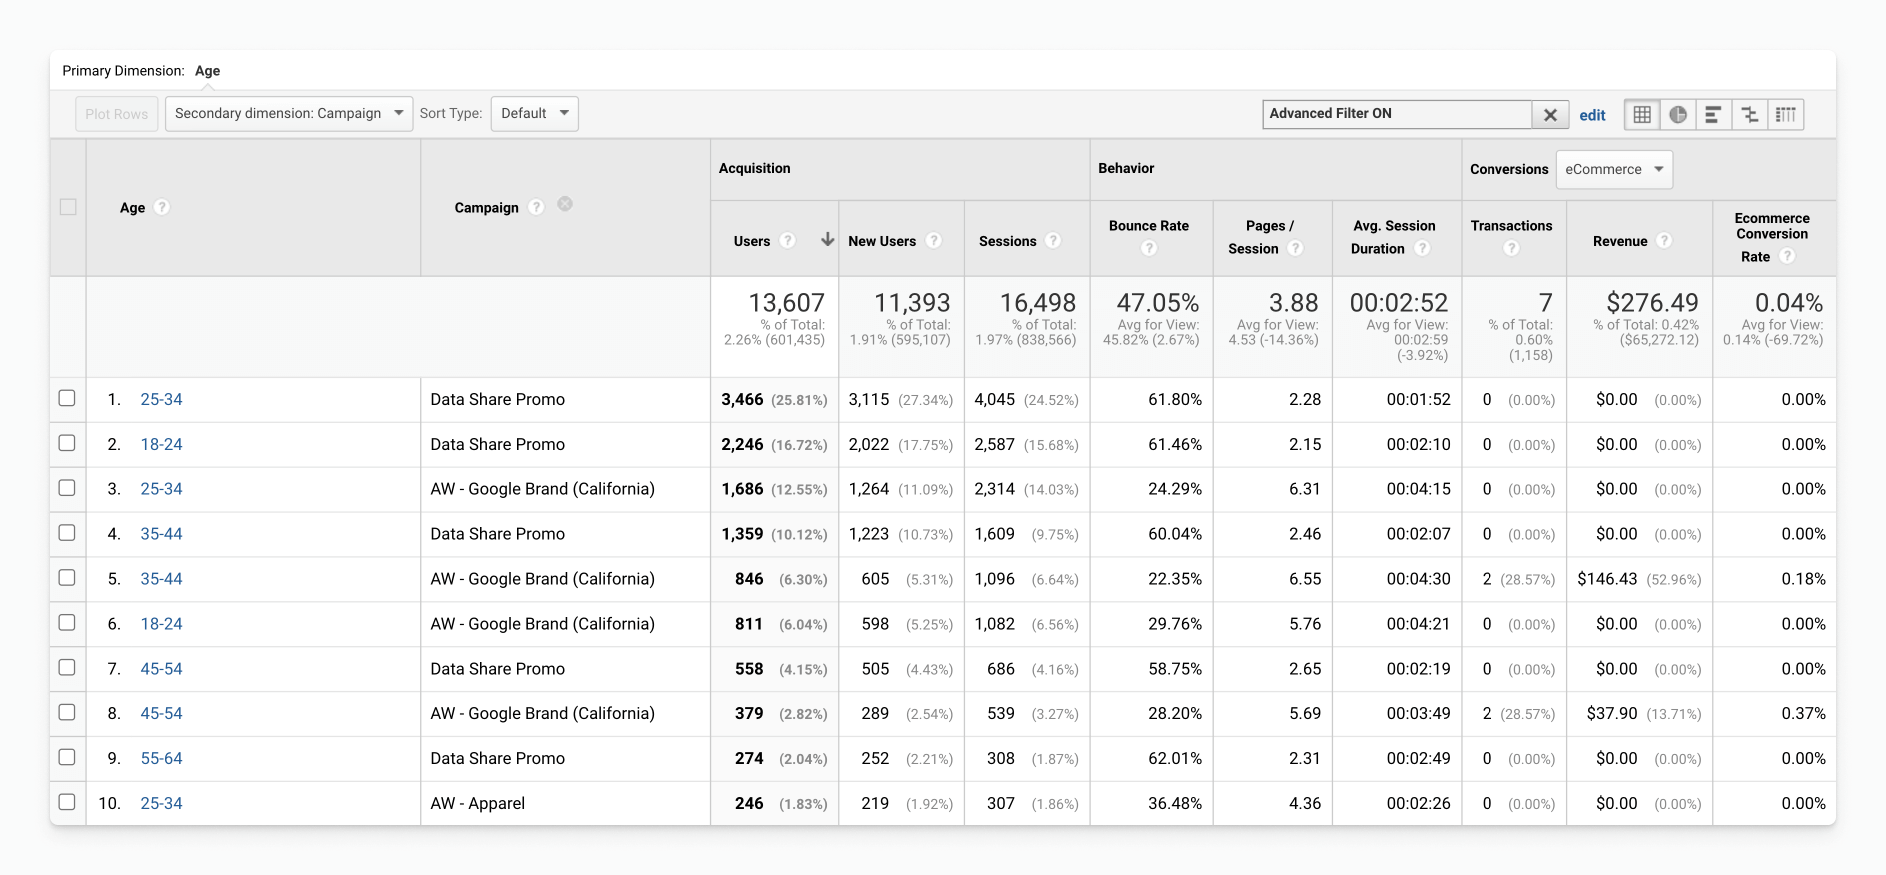
Gain deeper insight into your users and identify campaigns that resonate with particular audience segments. Go to Audience > Demographics > Age. Add Campaign as a secondary dimension to see which age ranges responded best to each campaign. Do the same with the Gender, Geo, Technology, or Mobile reports to evaluate performance across demographic segments such as gender, location, language, browser, device type, and more. Analyze the Interests report to understand if certain campaigns resonated with users’ overall interests (Affinity Categories) or a particular purchase intent (In-Market Segments). Examine the Behavior report to compare new vs. returning users. Use this to help identify successful segments, which can help inform your target audiences for future campaigns.
You can also use the Benchmarking report to compare your channels to similar companies by selecting the appropriate industry vertical, country/region, and number of daily sessions.
Understand Your Channels
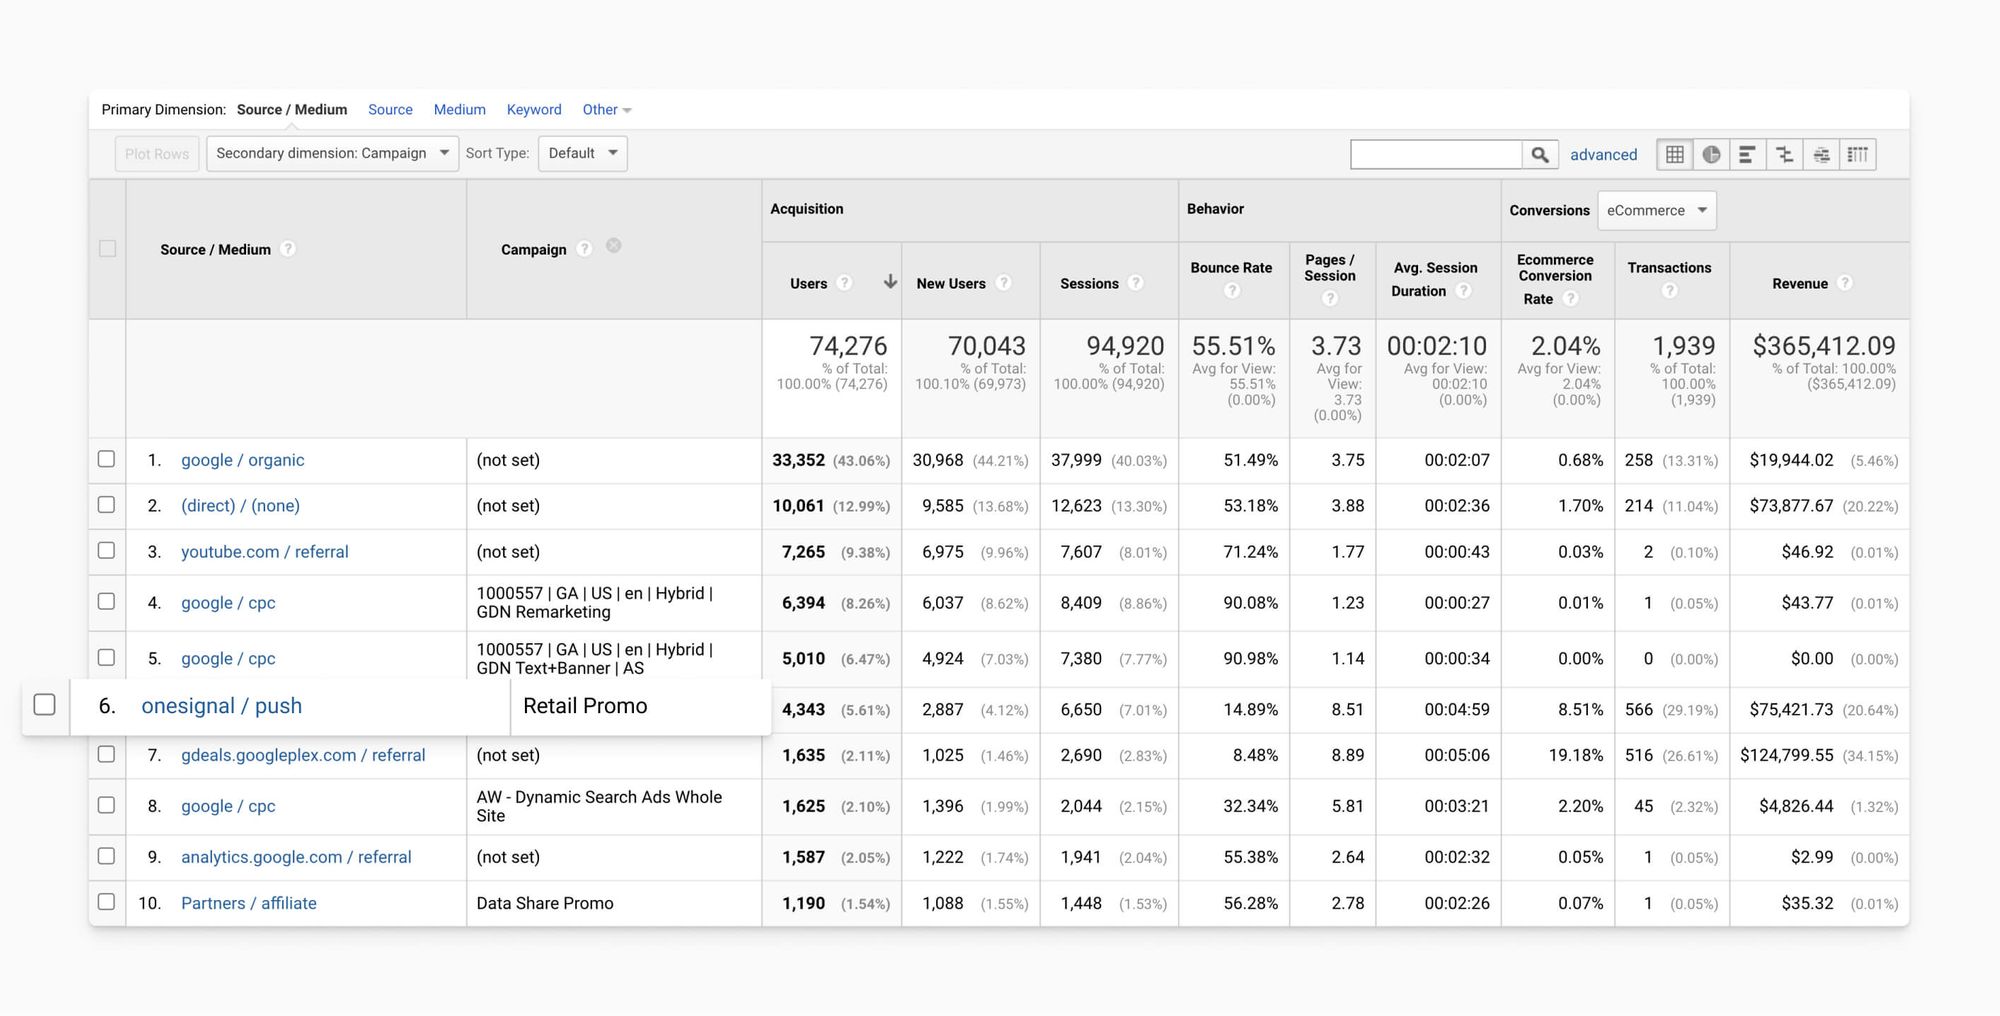
Analyze performance across your different channels to see which ones work for you. Go to Acquisition > All Traffic > Source/Medium. The Source/Medium report automatically groups source and medium pairings, and you can also look at only Source or only Medium. Compare the performance of push as a channel with your other channels, such as email or paid ad campaigns. Use this to optimize your marketing mix and get a full view of how overall channels have performed, whether it’s paid search, organic, or any other channel you may be using.
You can also add a secondary dimension for more information. For example, add Campaign to dig into results on a campaign level. Or A/B test your links and add Landing Page to understand how performance differs based on where the user lands on your site.
Understand Your Conversions
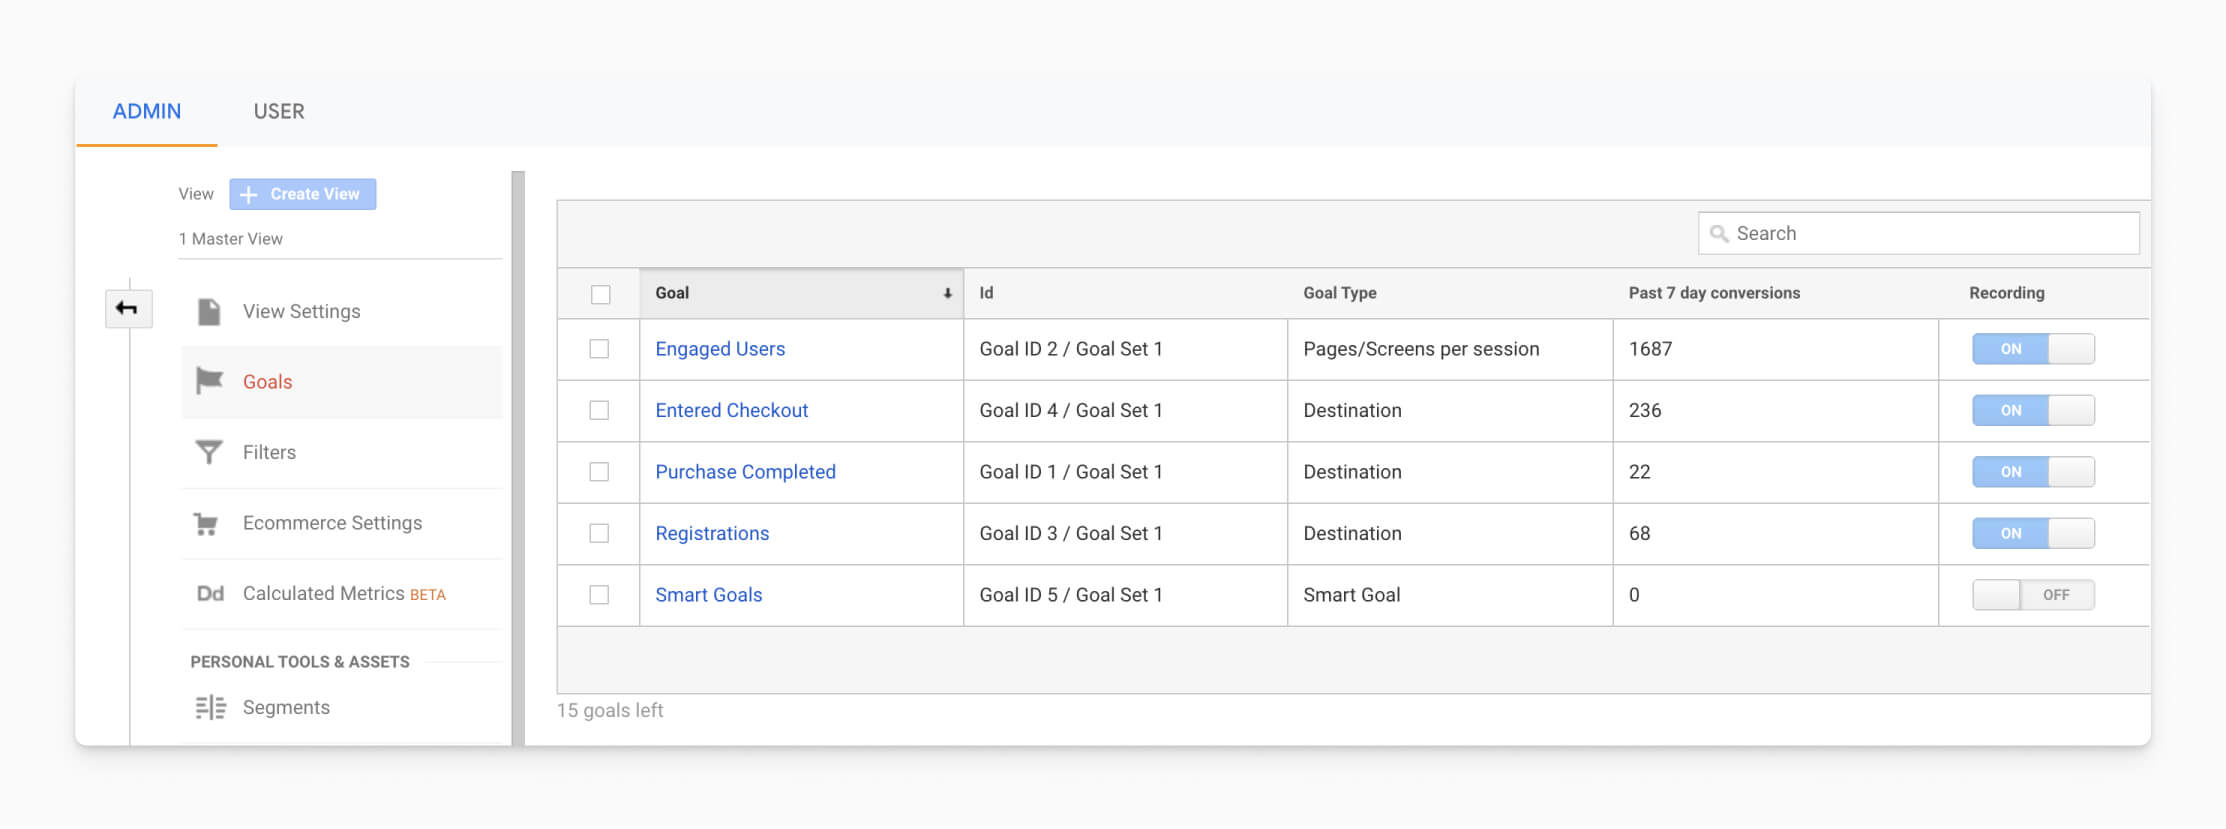
Set up goals in Google Analytics so you can track desired conversions and conversion rates, such as email signups or purchases. You can also set up a goal funnel to identify where users are dropping out. If you want to track revenue, you’ll need to enable Ecommerce Tracking in your reports and add additional code.
Goals are extremely important to use in tandem with UTM links in Google Analytics. They’re used to measure down funnel results as part of your main reports and can also help track the progress you’ve made on your main KPIs from campaign launches on different channels.
Understand Your Events
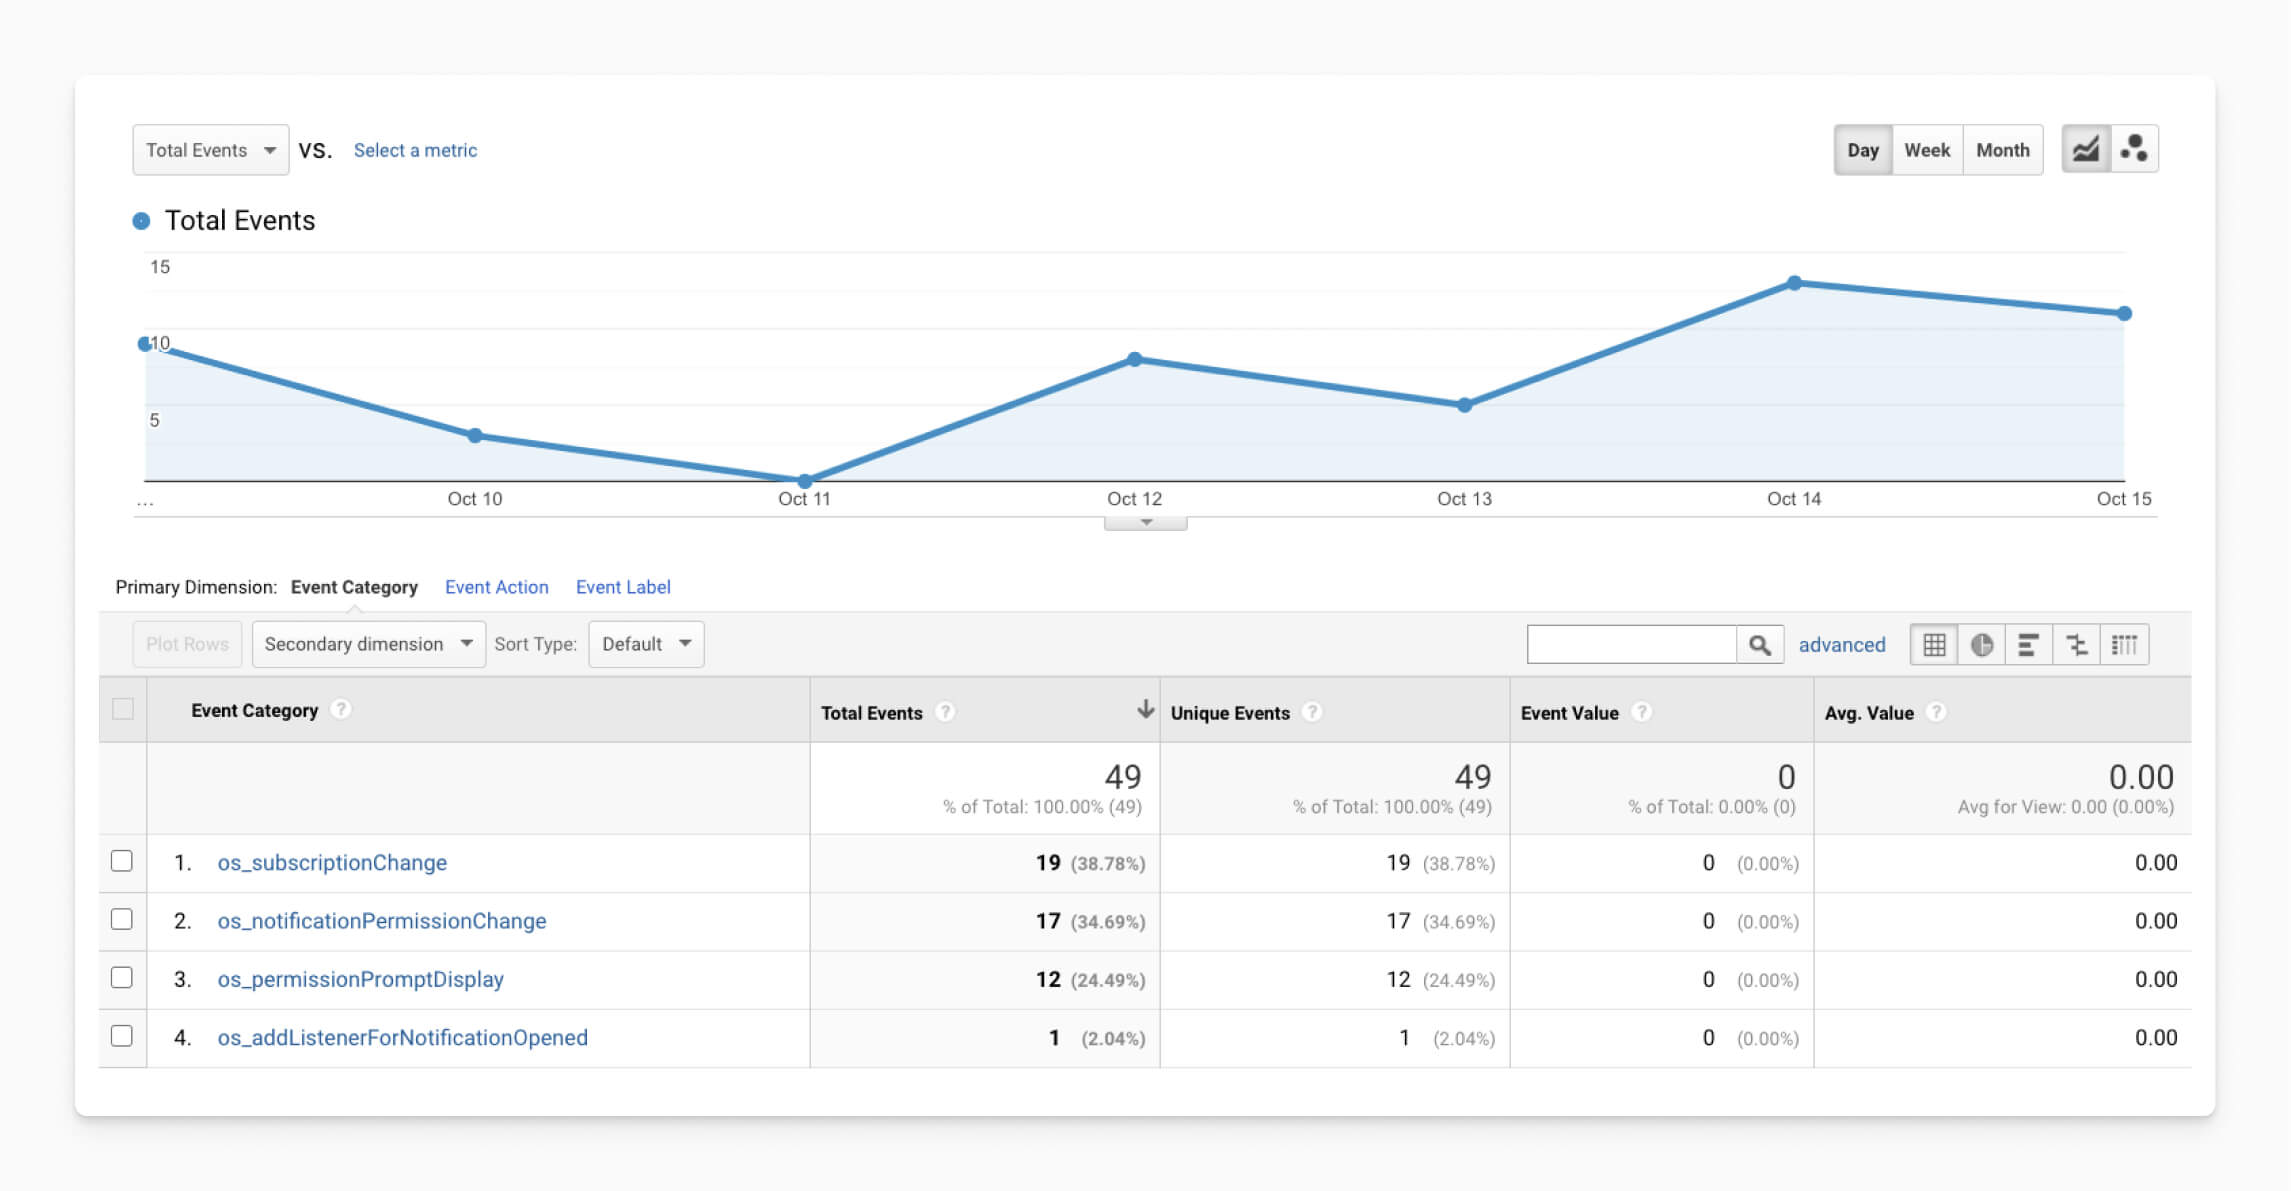
Set up and track the events that are relevant to your business. Go to Behavior > Events > Top Events. The Top Events report will show the results of the events you’ve set up for mobile and web. OneSignal makes it easy to track subscription and notification events, such as how many notifications were received, the actions taken on the native prompt, or how many people are clicking your push notifications.
You can also add Event Label as a secondary dimension to analyze the data by the actual values that were recorded for the event.
Understand Your Custom Data
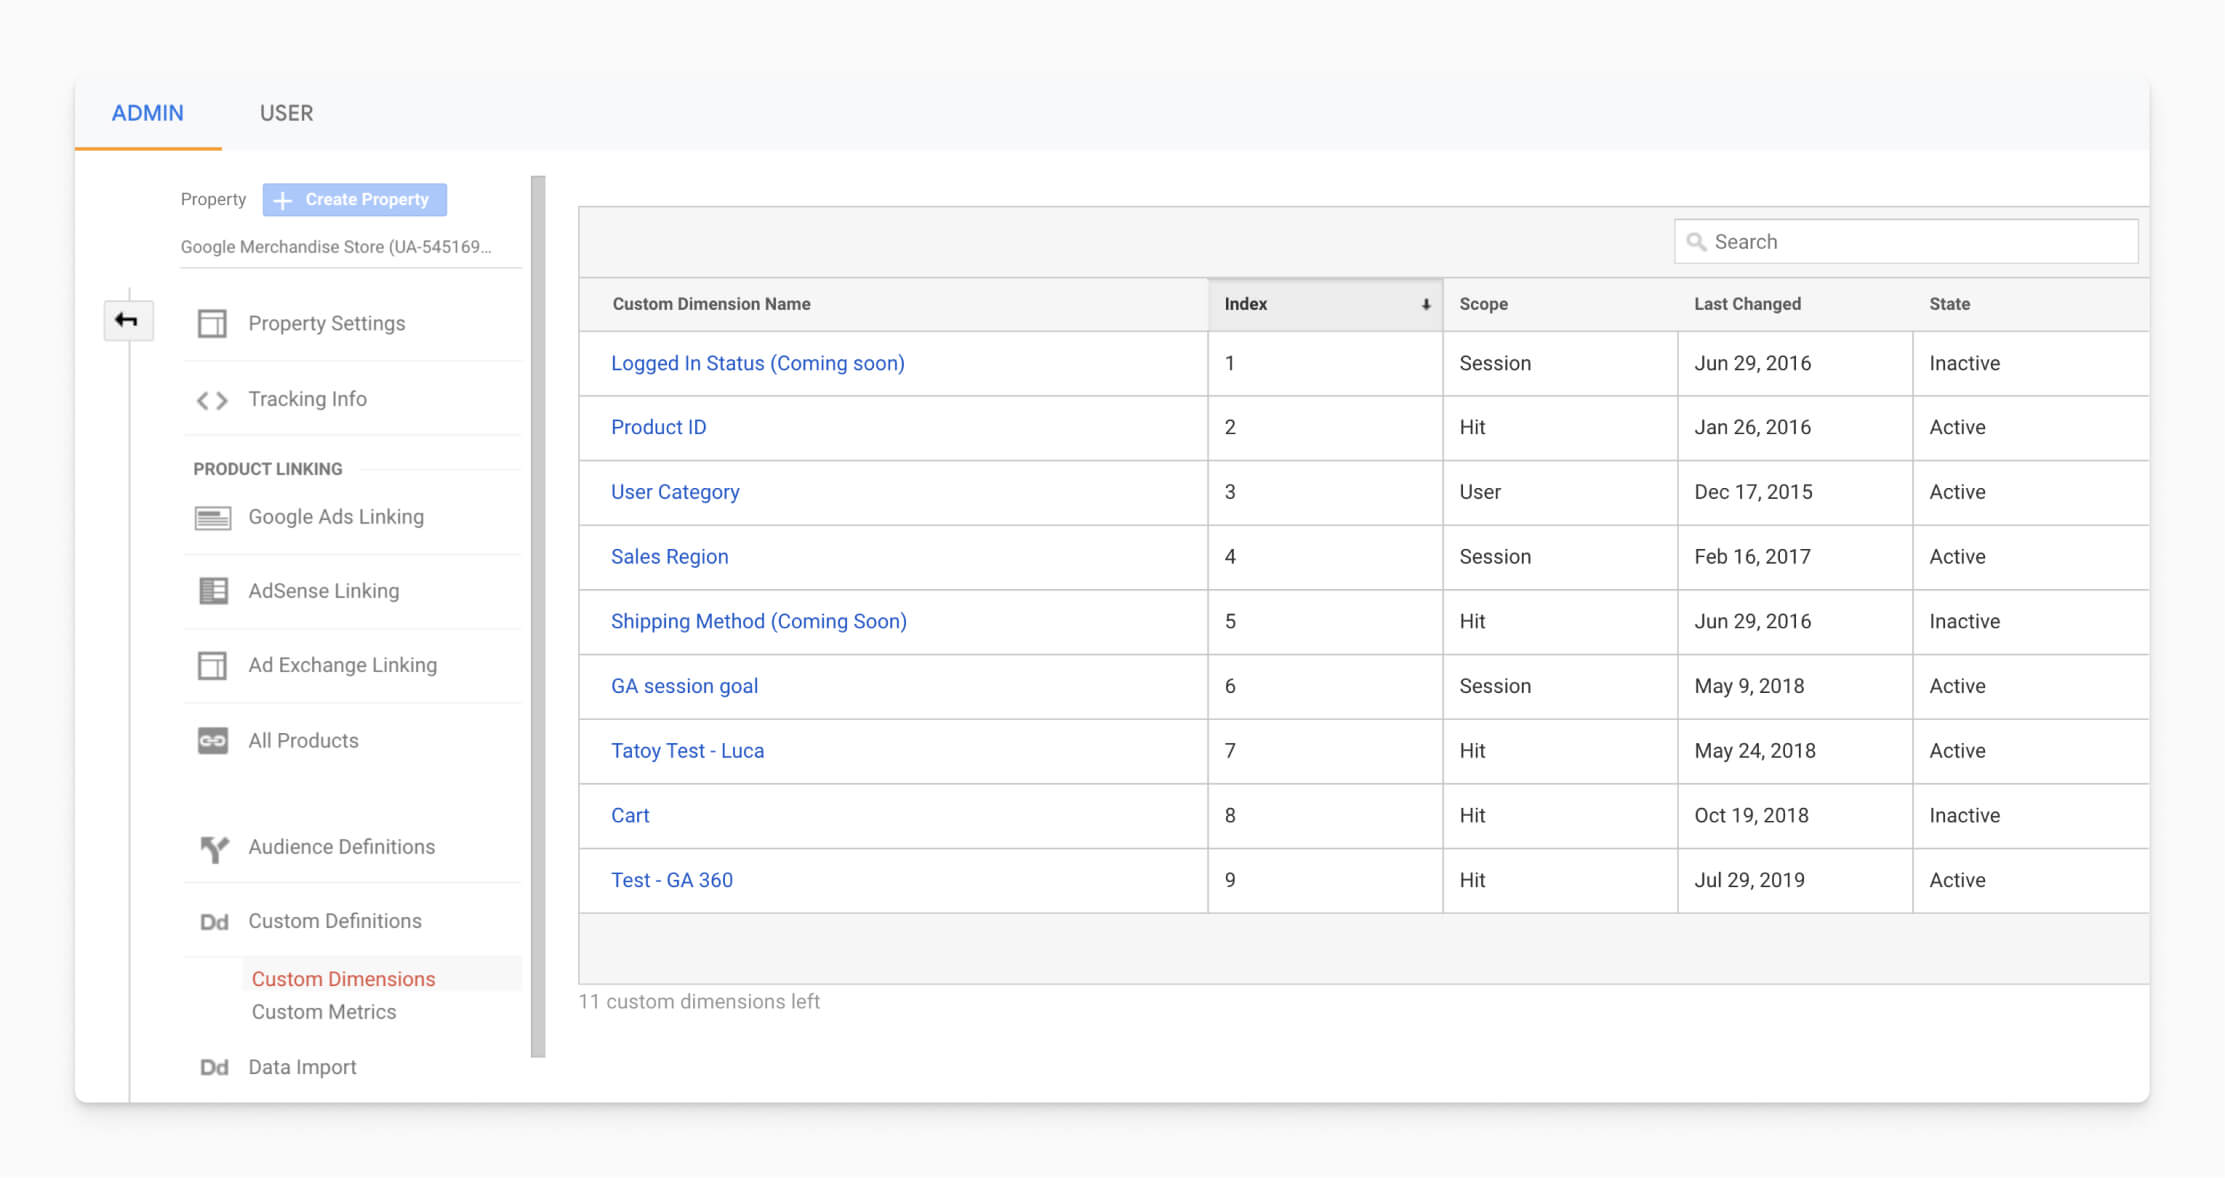
Set up custom dimensions and custom metrics to collect and analyze data that Google Analytics doesn't automatically track, such as level completions for gaming companies. You can also combine Google Analytics data with non-GA data, such as CRM data. This requires additional setup and tracking code.
Custom dimensions can appear as primary dimensions in Custom Reports. You can also use them as Segments and secondary dimensions in standard reports.
Next steps
Now, you’re equipped with the power to answer important questions such as how much traffic push drives, how successful that promotional campaign was, and other questions around the effectiveness of your campaigns. Ready to test new channels? Create a free OneSignal account today and see why over a million developers use OneSignal to supercharge their customer engagement across push, in-app, and email.