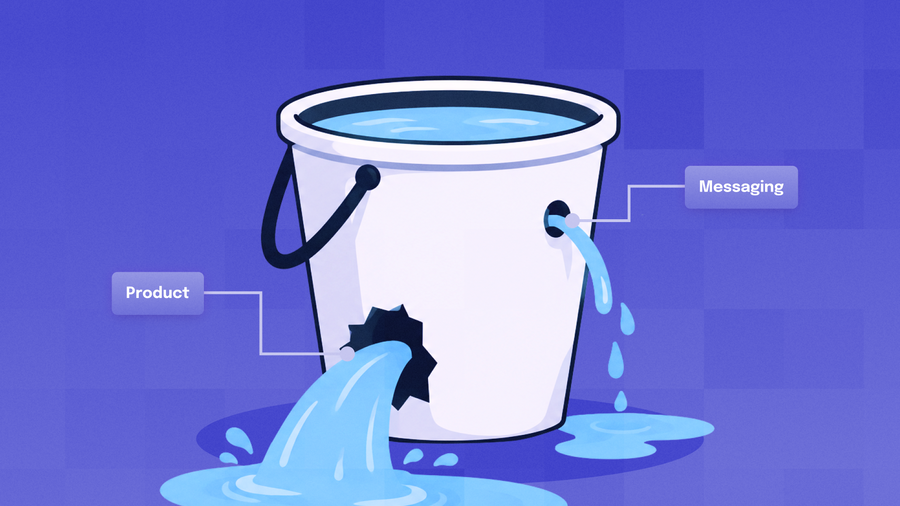
Messaging can bring someone back. It can't manufacture value that was never there to begin with. So when you are trying to diagnose a churn problem, how do you actually know if it's your messaging or your product that's to blame?
Here's how to tell which one you're dealing with before you spend another cycle on the wrong fix.
Before you blame the flow…
Your reach, relevance, and timing are all reposinsibilities of thoughtful messaging. It can help your audience finish setup, discover a useful feature, or return when their intent is likely to rise.
Messaging cannot create value for users who never experience the promised outcome or repair a weak product-market fit.
An analysis of 3.2 billion words from 31 million customer conversations attributed 27% of churn to product gaps, 27% to support, and 24% to messaging overpromises, as detailed in this LinkedIn post.
That relatively even distribution makes churn a (very) shared operating problem.
- Acquisition can set the wrong expectation
- Onboarding can delay value
- Product defects can block core actions
- Support can leave friction unresolved
- Lifecycle campaigns can add pressure at the wrong time
That's five different places the actual leak could be hiding, and no single dashboard is going to point at the right one for you. Effective mobile app marketing hinges on your ability to trace the path from acquisition through first value and repeat value, and see exactly where it breaks.
Separate messaging symptoms from onboarding and product symptoms
The distinction depends on where the failure occurs.
- Messaging symptoms usually appear after users demonstrate intent or receive meaningful value.
- Onboarding and product symptoms emerge before value, or they persist regardless of message exposure.
These categories can overlap! A confusing onboarding flow may cause abandonment, and an aggressive reminder sequence may increase opt-outs among the same users. Treat the categories as diagnostic starting points rather than fixed labels.
Signs the problem is messaging
Look for a change among users who previously followed a healthy usage pattern. Common signals include:
- Notification delivery or engagement declines after a stable period.
- Opt-outs rise after a campaign or frequency change.
- Broad messages reach users with different needs or lifecycle stages.
- Deep links open a generic home screen instead of the relevant action.
- Users who completed a meaningful milestone gradually stop returning.
- Campaign engagement looks healthy, but repeat product activity does not improve.
Frequency should follow your product’s natural rhythm. A daily reminder makes little sense for your app if it only delivers value once each week. For a product with a seven-day cadence, consider users at risk after 14 to 21 days of inactivity, using a churn window equal to two to three times the expected interval.
This approach comes from OneSignal’s guidance for retaining users of weekly-use products.
A messaging diagnosis should also inspect the destination. A relevant notification can still fail when it sends your users to a slow screen, an expired offer, or a page that requires several more steps.
Signs your problem is onboarding or product value
Pre-value abandonment usually points toward setup, usability, positioning, or the product itself. Watch for users who:
- Fail to complete required setup steps.
- Leave before the first value event.
- Repeatedly stop at the same screen or permission request.
- Encounter crashes, delays, synchronization failures, or missing data.
- Discover a mismatch between pricing and expected value.
- Receive an experience that differs from the acquisition promise.
Compare message exposure as well. When churn persists among both messaged and unmessaged users, the campaign is less likely to be the primary cause.
A brief survey sent at the moment of drift can capture reasons such as unclear setup, missing capabilities, price concerns, or a temporary change in need.
OneSignal explains how to combine observed behavior with intentional feedback from inactive users.
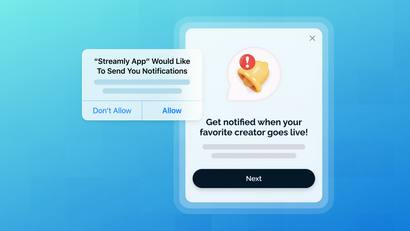
A customer engagement platform can guide someone back to an unfinished setup step. The setup must still be understandable and worthwhile. For example, a budgeting app can remind a user to connect a bank, but the connection flow must feel safe and lead to a useful financial view.
When the evidence points to more than one cause
Mixed evidence requires coordinated tests, right? Suppose users abandon during setup, support contacts mention confusing permissions, and reminder opt-outs rise. The likely problem includes onboarding friction and a messaging response that adds pressure without resolving it.
Map each symptom to the stage where it appears. Then separate upstream causes from downstream reactions:
- Acquisition sets an expectation.
- Onboarding asks your user to complete work.
- Your product produces, delays, or blocks value.
- Support resolves or compounds friction.
- Messaging reinforces the resulting experience.
Start with the earliest supported cause. Fixing a broken setup step may improve activation and make a later reminder useful. Changing reminder copy first leaves the original barrier in place.
Measure the journey from acquisition to repeat value
Retention flow: acquisition source → onboarding completion → activation event → first value event → repeat value event → retention or churn
Each stage should answer a different question:
- Acquisition source: Where did my user’s expectation begin?
- Onboarding completion: How much required setup did my user finish?
- Activation event: What action indicates readiness to use my app's core experience?
- First value event: What initial outcome did my user come to receive?
- Repeat value event: Did the outcome happen again?
- Retention or churn: Does my user meet the business-specific definition of continued use?
Build a retention funnel that exposes the leak
Define each stage as an observable event. “Engaged user” is too vague to diagnose. “Completed profile, connected a data source, generated a first report, and generated another report the following week” produces a usable sequence.
Remember, churn varies by business model. It may mean subscription cancellation, uninstall, or inactivity after a defined period. A standard churn rate calculation divides users lost during a period by the users present at its beginning, then multiplies the result by 100.
OneSignal’s guide to measuring mobile app user churn explains why the definition must fit the product.
Once the stages are measurable, find the earliest material drop. A low repeat-value rate means something different from high first-session abandonment. The former may support a re-engagement test. The latter calls for closer inspection of acquisition and onboarding.
Define the events and cohorts worth tracking
Your mobile app analytics tool should direct the next experiment, rather than merely report campaign performance. Track metrics that connect communication to product behavior:
- Onboarding completion rate
- Activation rate
- Time to value
- First-session abandonment
- Repeat key-event rate
- Feature adoption
- Notification delivery and engagement
- Opt-out rate
- Support contacts
- Retention by acquisition source and cohort
You'll want to avoid universal benchmarks for these measures. A meditation app, marketplace, banking app, and weekly planning tool have different usage patterns and value events.
Review multiple retention periods, including one day, one week, and two weeks. Pair them with app opens, app actions, specific events, and key-feature use to locate friction instead of relying on one retention curve.
OneSignal’s app engagement measurement guidance describes this multi-period approach.
Keep the event set focused. Every tracked event should clarify progression, friction, or value. A large event catalog with unclear business meaning creates analysis work without improving decisions.
Compare messaged and unmessaged users without mistaking correlation for causation
A raw comparison often favors messaged users because your active users are easier to reach and more likely to qualify for campaigns. That difference does not prove that your messaging caused retention.
Before comparing groups, align users on:
- Acquisition source
- Device platform
- Tenure
- Lifecycle stage
- Previous product activity
- Pre-message intent or behavior
- Eligibility for the same intervention
For example, compare users who completed the same activation event during the same period. Randomly withhold the campaign from part of that eligible population. Differences after the intervention then provide stronger evidence of incremental effect.
Cohort analysis can expose patterns and generate hypotheses. A controlled experiment must test whether the proposed change caused the outcome.
What should you fix first? Use symptoms to choose the next experiment
Fix the earliest, largest, and most causally supported leak in the journey. Do not default to a cadence change because messaging is faster to edit.
The first session deserves close attention. Apps that move users to a core value action during that session see Day 7 retention rates two to three times higher than apps that do not, based on Appcues retention benchmarks.
The right first fix may belong to product, onboarding, acquisition, support, or messaging. Use the evidence to assign ownership, then test the smallest change capable of affecting the identified leak.
Use messaging to reinforce value, not manufacture it
OneSignal is most useful as an execution layer after your team identifies a viable retention opportunity. It can coordinate communication, targeting, delivery, and measurement. Product behavior and user feedback must define what those communications should do.
Where Journeys and segmentation help
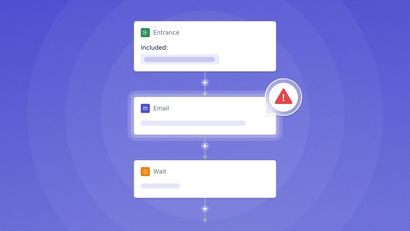
Journeys enables no-code messaging flows across channels for onboarding, retention, and re-engagement. Teams can automate steps according to lifecycle behavior instead of sending the same sequence to everyone.
Segments create dynamic groups from criteria such as behavior, location, Tags, and subscription status. Tags store custom metadata about preferences, behaviors, and user properties. Together, these capabilities can distinguish an interrupted setup from post-activation inactivity.
Useful applications include:
- Prompting your users to finish a specific setup step
- Explaining a feature when users reaches relevant context
- Reminding an activated user about a timely return moment
- Adjusting communication based on preferences or past actions
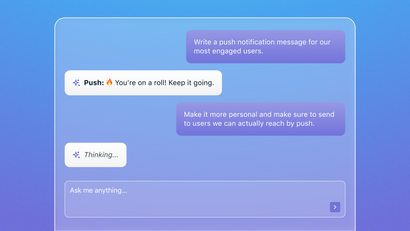
Personalization can combine user data, Tags, and dynamic content. It improves relevance only when the requested action and destination offer value.
Custom Outcomes can track conversion events and campaign impact. Detailed analytics then show delivery and interaction performance, which you can connect to product-level retention analysis.
A mobile app retention strategies checklist
Use this checklist to turn mobile app retention strategies into a routine shared by lifecycle, product, analytics, acquisition, and support teams.
- Define churn for your business model. Specify cancellation, uninstall, or an inactivity window tied to natural usage.
- Map the acquisition promise to first value. Confirm that ads, store listings, and referrals describe the experience accurately.
- Remove onboarding friction. Inspect every required step, permission, field, and delay.
- Measure activation and time to value. Use observable events connected to the product’s purpose.
- Verify reliability and support issues. Connect errors, failed actions, and support contacts to retention cohorts.
- Assess pricing and product fit. Look for users who understand the product but do not see enough value to continue.
- Segment around meaningful lifecycle milestones. These may include onboarding completion, a second purchase within 30 days, creating or sharing user-generated content, subscribing to a premium tier, or regularly using loyalty features. OneSignal’s lifecycle audit explains why milestones provide stronger signals than scattered micro-behaviors.
- Create behavior-triggered lifecycle messages. Tie each message to a known state and intended action.
- Match frequency to natural cadence. Base timing on observed product use rather than a generic daily schedule.
- Deep link to the next useful action. Remove unnecessary steps after the user opens a message.
- Collect feedback at moments of drift. Ask a short question when the user can still explain the barrier.
- Use holdouts and cohort analysis. Separate incremental impact from normal retention behavior.
- Evaluate retention beyond opens or clicks. Measure activation, repeat value, opt-outs, and long-term product activity.
Frequently asked questions
What counts as churn for a weekly-use mobile app?
Churn is inactivity beyond a window that reflects the app’s expected weekly use, rather than a universal number of days. Account for skipped cycles, seasonality, and paused routines before classifying someone as lost.
When should an app team ask users why they became inactive?
Ask near the first credible sign of drift or during cancellation, when the user can still recall the reason. Keep the survey short, allow an open-text response, and avoid pairing it with a promotional message that could bias the answer.
Once you know the leak, here's how to act on it
When you've found the actual leak, and confirmed messaging has a real job to do, you still need something that can act on that finding without becoming its own source of noise. That's what Journeys, segmentation, and Custom Outcomes are built for here: routing the right message to the right lifecycle moment, holding back when someone's already resolved the friction another way, and giving you the data to tell whether the fix actually worked instead of just whether the message got opened.
OneSignal is built to make sure that once you know, your messaging stops guessing and starts reinforcing what you've already confirmed is true.
Get Started for Free