Back in February, OneSignal launched our cutting-edge Journeys product. Here, we’ll share some engineering details about how the Journeys product was built and our design philosophy behind it. Specifically, we'll be diving into the overall architecture, the data model, and how we leveraged technologies including Rust, Kafka, ScyllaDB, and Honeycomb comprising our Journeys product.
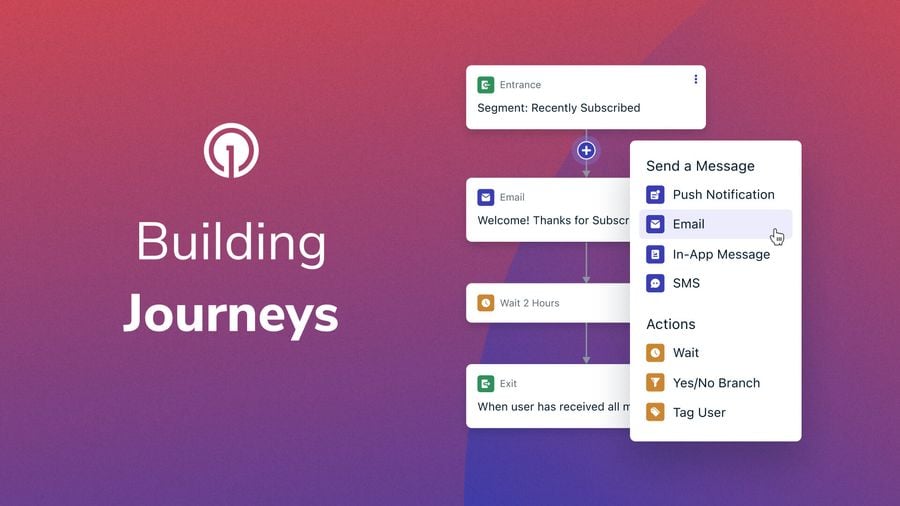
Before diving in, let’s define a “Journey.” From a customer perspective, it’s a messaging workflow builder. Our UI presents a set of actions such as waiting, branching, sending messages, and selecting and filtering audiences. These widgets can be linked together to form an execution graph. Designing that graph and the systems to move users through it is largely the focus of this discussion.
The two most popular approaches for Journey execution include the following..
- Polling: The executor can “poll” each Journey or node periodically to see which users should be advanced and then perform that work. When doing a survey of the market, we saw a lot of messaging automation builders, which took this approach, even if they appeared to be event-driven.
- Event-Driven: The executor can be fed events in real-time. This approach appeared to be much less common, despite offering some big upsides. For instance, actions a user takes in an application can be acted upon immediately, rather than waiting until the next polling period. That said, we can see why it’s less common. It’s hard!
OneSignal opted for the event-driven approach due to the improved experience our customers will get from the more real-time nature of such a system. For instance, a common automation flow is the “abandoned cart” pattern where a user should be re-engaged after some period of time of inactivity, perhaps 10 minutes. The event-driven approach allows us to be precise in hitting that 10-minute mark, rather than waiting for the next polling period which could result in messages being sent much later than the expected time!
Choosing this approach also meant we were opting for some extra challenges. The hardest part of event-driven journeys is the “wait” action. This needs the equivalent of JavaScript’s setTimeout function. The polling approach basically gets this for free because it’s always checking each user in a wait node every polling period. However, for the event-driven approach, we need a scalable setTimeout. Because of OneSignal’s scale, it needs to be very scalable — on the order of 10s of billions of timers queued up at any moment.
Data Model
Understanding our data model is core to the logic behind the systems we built. Our goal was to implement a model flexible enough to express any Journey graph our customers could conceive of. That’s not to say every feature is supported from the outset, but rather that the core way we design the graph and user states would be flexible enough to support arbitrary extensions.
We’ll present a few example journey graphs to help illustrate the rationale behind our design, and then we’ll go into the specifics of the design itself. You can think of this series of examples as requirements gathering. To start, let’s consider a simple graph with a start node and an end node that’s selecting first time users.

There’s two states a user can be in— the start or the end. The only users we expect to make it to the end are those that have a session_count of 1.
A slightly more complex graph might include sending a message:

This is the same flow as before, except that a message send also happens before reaching the end of the graph. Typically, journeys will contain multiple message-sending steps separated by waits.

This is starting to look like a real Journey, and we are able to start considering the data model. There’s a couple of verbs on this chart— wait 60 seconds, send a message. These words describe actions. There’s plenty of other actions we care about—sending other message types, such as in-app messages, emails, tagging a user, sending an API request, and so on. At this point, it seems nice conceptually if we specify these actions on data as a node.
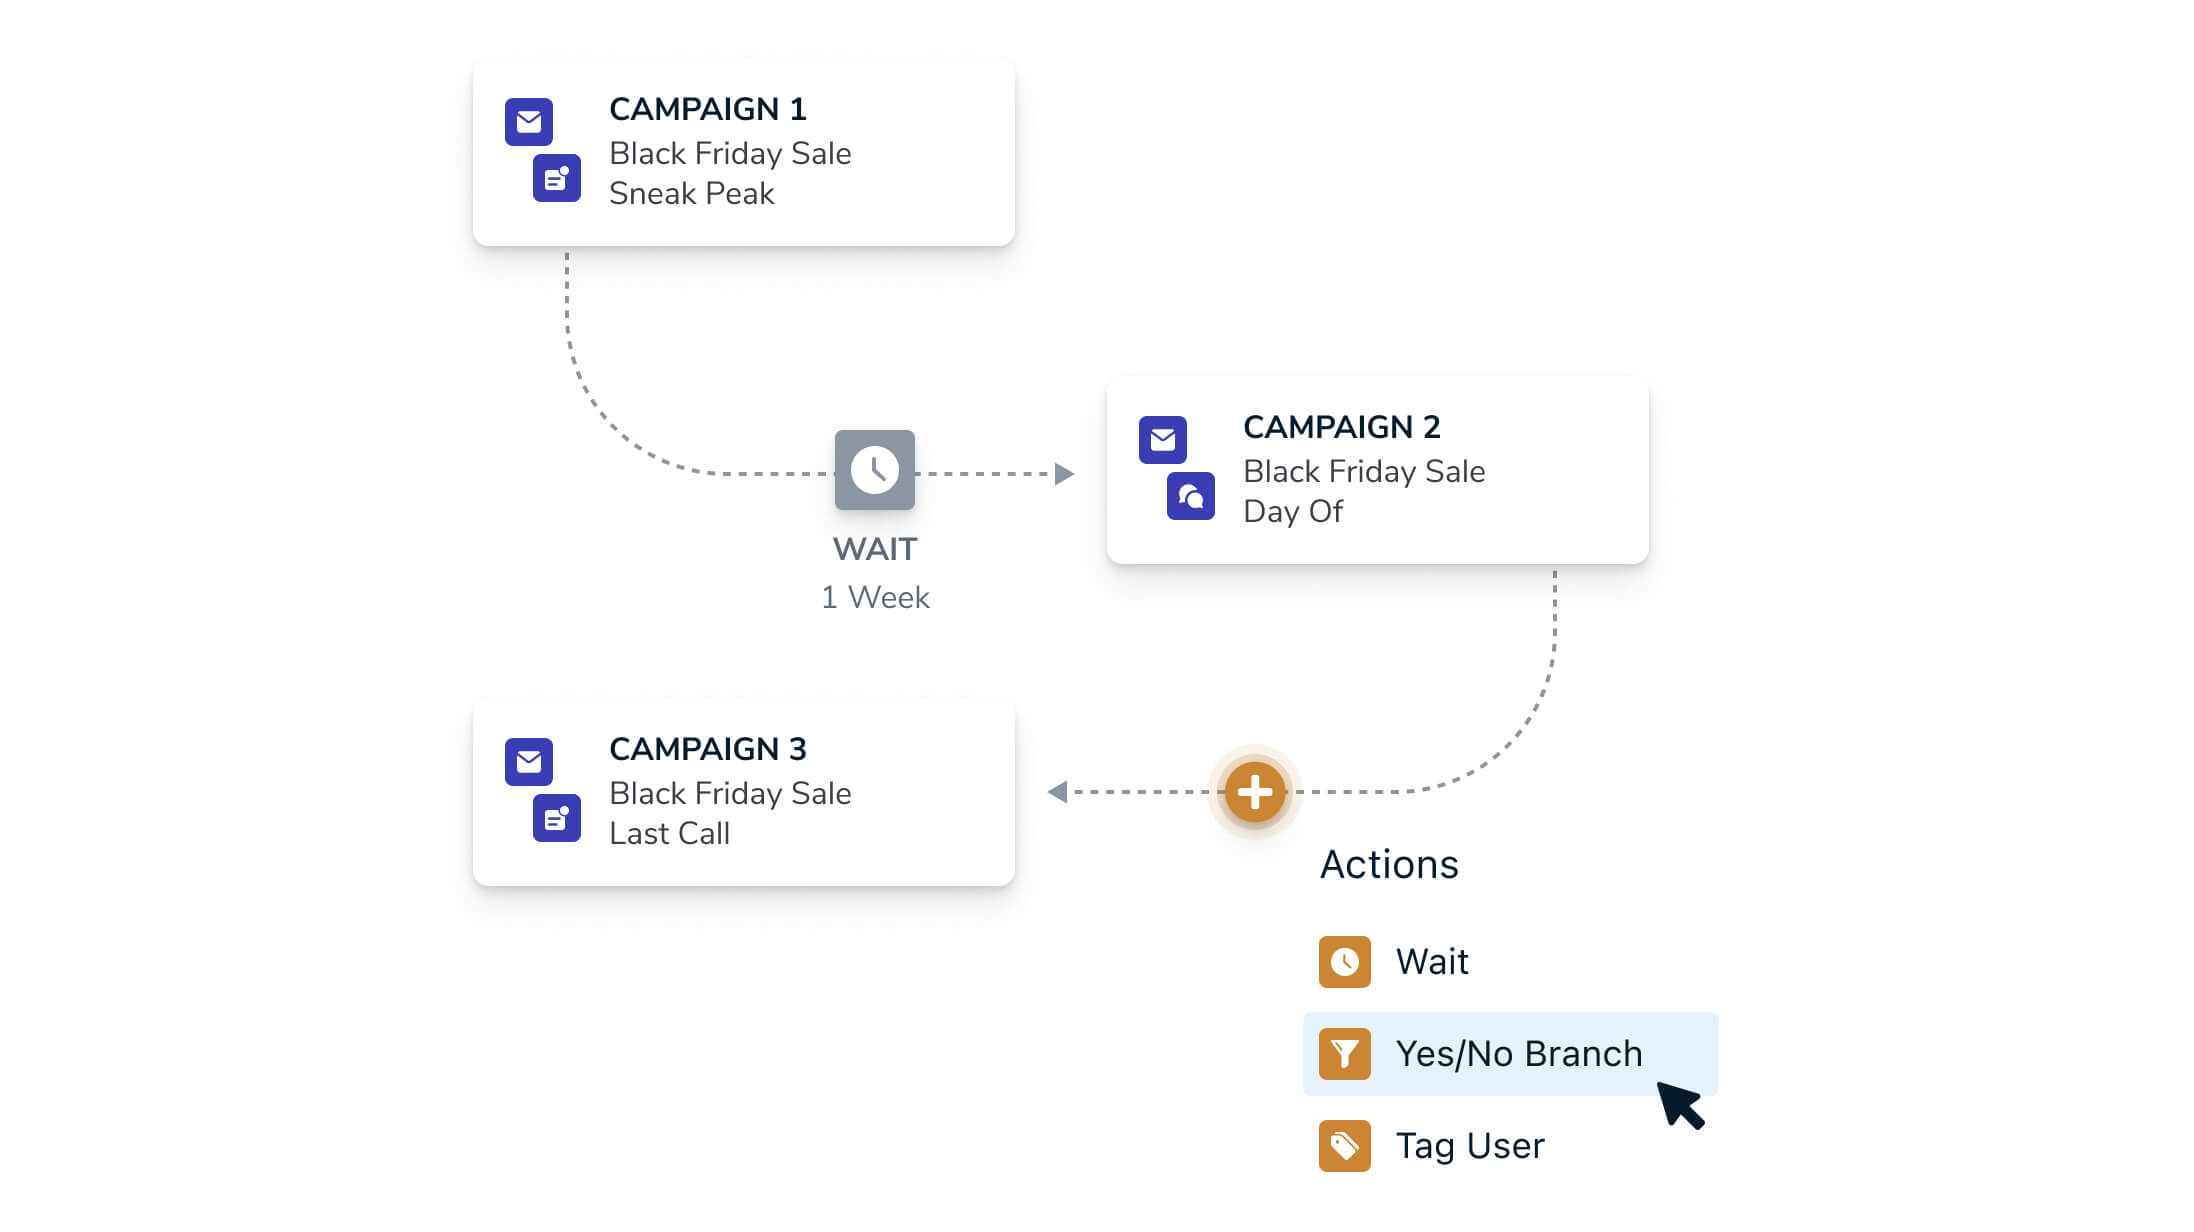
There’s one more component that’s necessary to make journeys really interesting, and that’s branching. Here’s an extension of our example with two paths after a branch:

Branching lets a journey take different paths depending on the result of the check. This example uses a “segment membership check” to choose which message variant to send. The decision node has two edges leading away from it. This is starting to get to be a lot of data for the decision node to know about, both the set of nodes to advance the user to based on the result of some condition, and the conditions themselves. And what if we want to support multi-branches that can have more than two destinations? What about branches based on conditions other than segments? Either the data and logic for that node are going to become increasingly complicated, or we need a more composable approach.
It’s at this point, that we had our big insight into how to make this data model very generalized and extensible— by putting the transition data on the edges. Let’s take another look at that same graph, but with all the transition data moved to edges.

The decision node became an empty node with no actions. In this scenario, it’s simply a place to attach those edges. The decision logic is the same as before, just moved to the edges. However, there’s something more powerful about this version —other edges unrelated to that decision could now be attached! In this version, there’s no such thing as a decision node at all, only conditional edge traversal.
With this data model, we can implement all sorts of sophisticated logic using only basic building blocks. For instance, if we want to “wait up to 30 minutes for a user to open a message or otherwise take a different path”, we could have a node with two actions, send message + start timer, and two edges leading away from it, timer fired and push opened.
To summarize the journey data model, we have a graph of nodes linked by edges. Nodes contain zero or more actions, such as sending messages, starting timers, and so on. Edges connect nodes and specify the conditions (such as segment membership, timers firing, etc.) that must be met to traverse them onto the next node. All nodes can branch because they can have one or more edges and take the first matching edge.
The node a user occupies is stored on what we call a User State. This is simply a pointer to a node they occupy and a blob of data related to their activity in the graph such as the ID of the timer they are waiting to fire. The user state data is very high cardinality, so it was important to make it lightweight.
Architecture
With the data model in hand, we can finally discuss the architecture of our Journeys product. We’ll be going into all these systems in detail in the next section, but let’s start with an overview.

Journey Executor is the heart of journeys. This is a Kafka consumer which processes events from the API, timers, and more, and advances users through Journeys. The State/Graph service provides persistence for both the journey graphs and user states within those graphs. These are the only two journeys specific services.
TimerDB is our message scheduling layer on top of Kafka. This allows the journey executor to perform those “start timer” actions and get a ping back later on the topic they are already receiving messages on.
Last, we have the supporting services. These are various services that either enable the execution of Actions, or serve to evaluate conditions on edges. Shown on the graph are the messaging service and audience service. There are additional supporting services, but these are the ones most important for journey execution.
Systems in Detail
Journey Executor
Journey Executor, or journeyx for short, is responsible for processing every event generated by a user and trying to advance them through any journeys they currently or could occupy. journeyx is effectively a Kafka consumer combined with a state machine processor. Performance is paramount for this system. We receive 100k events/sec, and we want to process them in as near to real-time as possible. That’s why we wrote it in Rust, like our other Kafka consumers.
The key characteristics and responsibilities of this system include
- Kafka consumer, processing ~100k events/sec across all instances
- Processing each event 1 at a time and advancing every Journey accessible to that user
- In doing so, journeyx may
- Read from the State/Graph service to fetch journeys
- Query the audience service to test segment membership edges
- Send messages including push, email, etc.
- Start timers
- Manipulate user data (eg, adding tags to a user)
- Write to the State/Graph service
Despite that longish list, journeyx is rather simple in its responsibilities. It can test edge conditions for traversal (advancing a journey), and it knows how to perform actions, such as sending a push. It’s also easily extended by adding more traversal tests and actions.
We won’t be diving into each of those functions directly as many simply boil down to “send this query to a gRPC” service. Instead, we’ll be looking at a couple of interesting pieces of design to make this system reliable and scalable.
Performance
The safety guarantees of Rust make it easy for us to make some interesting optimizations without having to stress about race conditions. The first of these is that we sub-partition the assigned Kafka partitions. You can imagine this like breaking a queue into multiple smaller queues.

Events on a given partition generally need to be processed in order, but a global ordering for the partition is not important for the journeys use case. Ordering is crucial at the user-level, where these events must not be processed out of order.
This gets tricky with commit semantics. The way a consumer tells Kafka which messages it has processed is by specifying the latest processed offset for that partition. There’s not an option to say later messages were processed without also saying that every message before it has been processed. This means that to support the extra concurrency, we need to track the commits locally for each sub-partition and only when a contiguous segment of offsets accumulate can a commit message actually be sent to Kafka. Consider the following example..

The boxes with numbers represent the offsets of messages that have been processed. Because message 1 has not yet been completed, no offsets can be committed to Kafka. However, once message 1 finishes processing, a commit may be sent to Kafka all the way up to message number 5.
With any sort of parallelism, this commit tracker will be shared across a number of threads. Rust of course makes this quite easy and safe to do. There’s a number of options for doing so. In this particular case, we have an async task pulling from a multi-producer, single-consumer message queue, which owns the tracker and the Kafka commit activity. Sub-partition processor tasks completing event processing need only to produce a message on the send side of that internal offset tracker queue.
The sub-partitioning feature helps us get extra parallelism for processing disparate events, but what about performance for processing a single event? An interesting aspect of journeys is that a single event can advance numerous journeys; on our enterprise plan, that’s up to 100 journeys a single event can advance! However, processing an event for each journey synchronously would be O(n) with the number of journeys, and that wouldn’t let us meet our journeys SLO.
This is roughly how our process each journey for an event looks:
for journey in journeys {
    Processor::from(self).process(journey, user, event).await;
}
The processor ends up with a bunch of shared state internally including gRPC clients, shared caches, and so on. Rust’s async/await requirements enforce that the process task is already Sync and Send which basically means the task is thread safe.
In this version of the code, each journey is processed one after another. How can we make these execute concurrently?
There’s a really cool primitive available in the futures crate called FuturesUnordered, which allows you to push a bunch of tasks onto it and run them all concurrently. That’s exactly what we need!
With that, our code becomes
// Build up a list of process tasks to execute concurrently.
let tasks = FuturesUnordered::new();
for journey in journeys {
    tasks.push(Processor::from(self).process(journey, user, event));
}

// Run the tasks
let results = tasks.collect::<Vec<_>>().await;
With very little code, each journey possibly affected by that event is being advanced concurrently, and the total processing time for an event becomes only slightly longer than the slowest journey to update! This can be seen visually in the Honeycomb Trace later in the post. Look for all the process_journey spans that overlap one another.
Rust’s async/await system has been the subject of much debate recently. For us, it’s been a pleasure to work with. The fact that we can easily build a system with this much concurrency while maintaining simple APIs is a testament to its power and flexibility.
Error Handling
Processing a stream of events can be quite unreliable at times! The consumers are regularly rebalanced whenever we deploy and upstream systems encounter errors. Couple this with the fact that we are processing events on each partition out of order, and it’s pretty much guaranteed that occasionally events will be processed multiple times.
That might sound dangerous at first, but it’s actually a really nice property for encouraging good system design! Each action that the journey executor takes for an event must therefore be idempotent. This means that even if we process an event many times, the side effects will only be visible once. For instance, our send_push messaging API accepts an idempotency key. We generate this key by deriving a value from the event ID and including it in our push requests. If we make that request multiple times, a message will not be sent on subsequent calls.
By making all actions idempotent, it frees us to retry sporadic errors without worrying about things like double sending, repeating state transitions, etc. Ultimately, this means greater reliability for our customers and their users by ensuring we never miss an update.
Journey Loader
The discussion of journeyx largely covers ongoing execution of journeys but not how they get kicked off. For instance, when a customer ships a Journey, much of their selected audience may already be eligible to receive it. Rather than wait for events to occur organically and for those users to trickle in, we have the Journey Loader to kick things off.
There’s not actually much to dive into here. The Loader reuses many of the same abstractions as broadcast message delivery from our core product. The main difference is that, rather than queuing up push notifications or emails to be delivered, the Journey Loader emits a bunch of no-op events on Kafka for the relevant audience of the new journey; journeyx then sees those no-op events and gets the users started on their way.
State/Graph Service
With the goal of having journeyx be a “dumb” execution engine, something has to tell it what to do, and that’s the State/Graph service. This service stores the Journey Graphs and all of the individual User States within those graphs. Graphs are configured via our UI at app.onesignal.com, and the user states are populated by journeyx. Data is persisted in ScyllaDB and exposed via a gRPC API. The service is written in Golang.
The actual graphs visible in our UI may look a little different from the execution graphs discussed in the Data Model section. This allows us to provide higher level abstractions to our customers using journeys while maintaining a highly flexible model on the backend. The State/Graph service translates those user-friendly graphs into the execution graphs upon request from journeyx.
This service is simple by design. It’s a wrapper on a DB, and it provides a mapping from the customer-facing graphs to the execution graphs. The most interesting part of this system is probably the database selection and schema design.
ScyllaDB
ScyllaDB is designed as a high-performance drop-in replacement for Apache Cassandra. That is to say, it’s a fast and scalable column store.
From their website,
ScyllaDB is the distributed database for data-intensive apps that require high performance and low latency.
This makes it a great fit for Journeys because of the User State data we’re storing. This is a high cardinality data set since we’re storing a state for each user for each journey they are in. An app with 1 million users and 100 active journeys could therefore have up to 100 million user states!
The schema design is a lot more nuanced in this type of system than in traditional SQL DBs. One of the key reasons for that difficulty is because of partitioning. In order to provide a highly scalable database, Scylla requires the data to have many small partitions. Because of that partitioning, the way the data is queried must inform the schema design.
For the User State model, we initially chose a partitioning key of (app_id, journey_id, user_id), because it would basically ensure a fixed partition size, but this wasn’t optimal for other reasons. Recall that journeyx processes every journey when a user generates an event. Thus, we must load every existing User State for that user -- one for each journey. Ideally that would happen in a single query. For instance, in the relational DB world, you might emit a query like
SELECT * from user_states WHERE app_id = 1 AND user_id = 'foo';
However, because we put the journey_id in the partitioning key, the user states all live on separate partitions, and that requires emitting a query per partition.
The fix is simple; we can drop the journey_id from the partitioning key, and then all of the user states will be on a single partition for each user. Nice!
Despite the poor choice of partitioning key for this data set and sending way more queries than needed by a better schema, the performance was still great — Scylla is extremely fast.
TimerDB
A scalable setTimeout API is required to support the wait nodes in our journey graphs. We built a hierarchical timer wheel DB to store billions of active timers, and we call it simply TimerDB. It’s actually a few different components:
- ScyllaDB stores the timers
- timerdb-api provides a gRPC API to schedule and fetch timers
- timerdb-scheduler manages actually firing those timers
The system as a whole serves to provide a message scheduling API on top of Kafka. The method for scheduling a timer is like so:
set_timeout(epoch: Timestamp, payload: &[u8], kafka_topic: &str, kafka_partition: i32)
When a timer epoch is reached, the payload is produced to a Kafka topic and partition specified by the remaining arguments. Downstream of this, the consumers (like journeyx) don’t need to know anything about timers, and they interface with Kafka as would any other consumer application.
The scheduler component is continually fetching timers from the DB for execution. Thanks again to async Rust, this was actually really easy to write. For each timer, we spawn a timer task which will produce the Kafka message after a tokio::sleep.
Beyond journeys, we’re looking forward to leveraging TimerDB to modernize and improve our intelligent delivery features for messaging campaigns. There is some future work to continue scaling this out which basically means using Raft for the scheduler instances to coordinate which hash range of timers they are each responsible for.
Audience Service
This service answers one of the most important and frequent questions within a journey graph: “is user X a member of segment Y?” The service itself is rather simple. It’s yet another gRPC API, except this time it’s backed by another gRPC service which in turn is backed by our user data store, PostgreSQL. The purpose of this API is to simplify journeys as a whole. Although journeyx could do all the heavy lifting to fetch segment IDs, compose constraint combinators, and fire them off to the upstream service, it’s far simpler if all it must do is pass those segment IDs along to audience service. We’re a big fan of small building blocks that can be composed in powerful ways, and Audience Service fits that paradigm.
Beyond its utility to journeys, this service is notable as our first Rust gRPC service. Years ago when we first started writing high performance HTTP servers at OneSignal, we felt Rust wasn’t mature enough for our productivity needs at the time. Audience service was sort of a pilot to see if that’s changed, and we’re happy to say that we will be writing all of our HTTP and gRPC services in Rust going forward. But more of that in another post.
Frontend
Although this post is largely focused on the backend and execution side of journeys, it wouldn’t be complete without a mention of how the Journeys UI was built. The OneSignal frontend as a whole is a React SPA powered by our dashboard API from Rails. To build the journey graph, we leveraged React Flow for a lot of the heavy lifting.
Observability
Journeys has many moving parts, and for that reason it was critical for us to invest in good tooling. Without good observability, Journeys could have been a nightmare to debug.
All of our services publish span data using OpenTelemetry to an internal Refinery cluster. Refinery is a “trace-aware sampling proxy” that allows us to make sampling decisions at the trace level, (which involves several disparate services) rather than at the service level, which doesn’t give the full picture. Refinery allows us to record all of our Journey traces with errors while heavily sampling all of the nominal traces.
OneSignal uses Honeycomb to search, graph, and visualize our distributed trace data. Here’s an example trace initiated by journeyx. Notice in the center column there are several services involved including journeyx, journeys (the State/Graph service), audience, and perseus. Although this doesn’t show every system involved, it gives you an idea of the level of visibility we have into production journeys traffic.

One important thing to note in this visualization is the concurrency of the process_journey spans. Each of those spans represents a different journey being advanced for the current event. We can see in this image process_journey durations of 16ms, 10ms, and 11ms. The whole trace is only 20ms long. By running these all concurrently, we save a lot of execution time!
Conclusion
That was a lot. We covered different approaches to journey execution, requirements gathering, and our data model. We’ve also covered our OneSignal Journey architecture and several systems in detail including Journey Executor, the State/Graph Service, TimerDB, and more. We leverage modern technologies like Rust, Golang, gRPC, and ScyllaDB to deliver a high performance and scalable Journeys product.
Our Journeys infrastructure was designed from the ground up to be extensible, and we have new features we’re working on every day.
Join Our Team
Does this content sound fun to you? Want to help out? You’re in luck, because OneSignal is hiring in Engineering across all parts of the stack!
View OneSignal Careers